Copyright
©The Author(s) 2022.
World J Gastroenterol. Aug 28, 2022; 28(32): 4600-4619
Published online Aug 28, 2022. doi: 10.3748/wjg.v28.i32.4600
Published online Aug 28, 2022. doi: 10.3748/wjg.v28.i32.4600
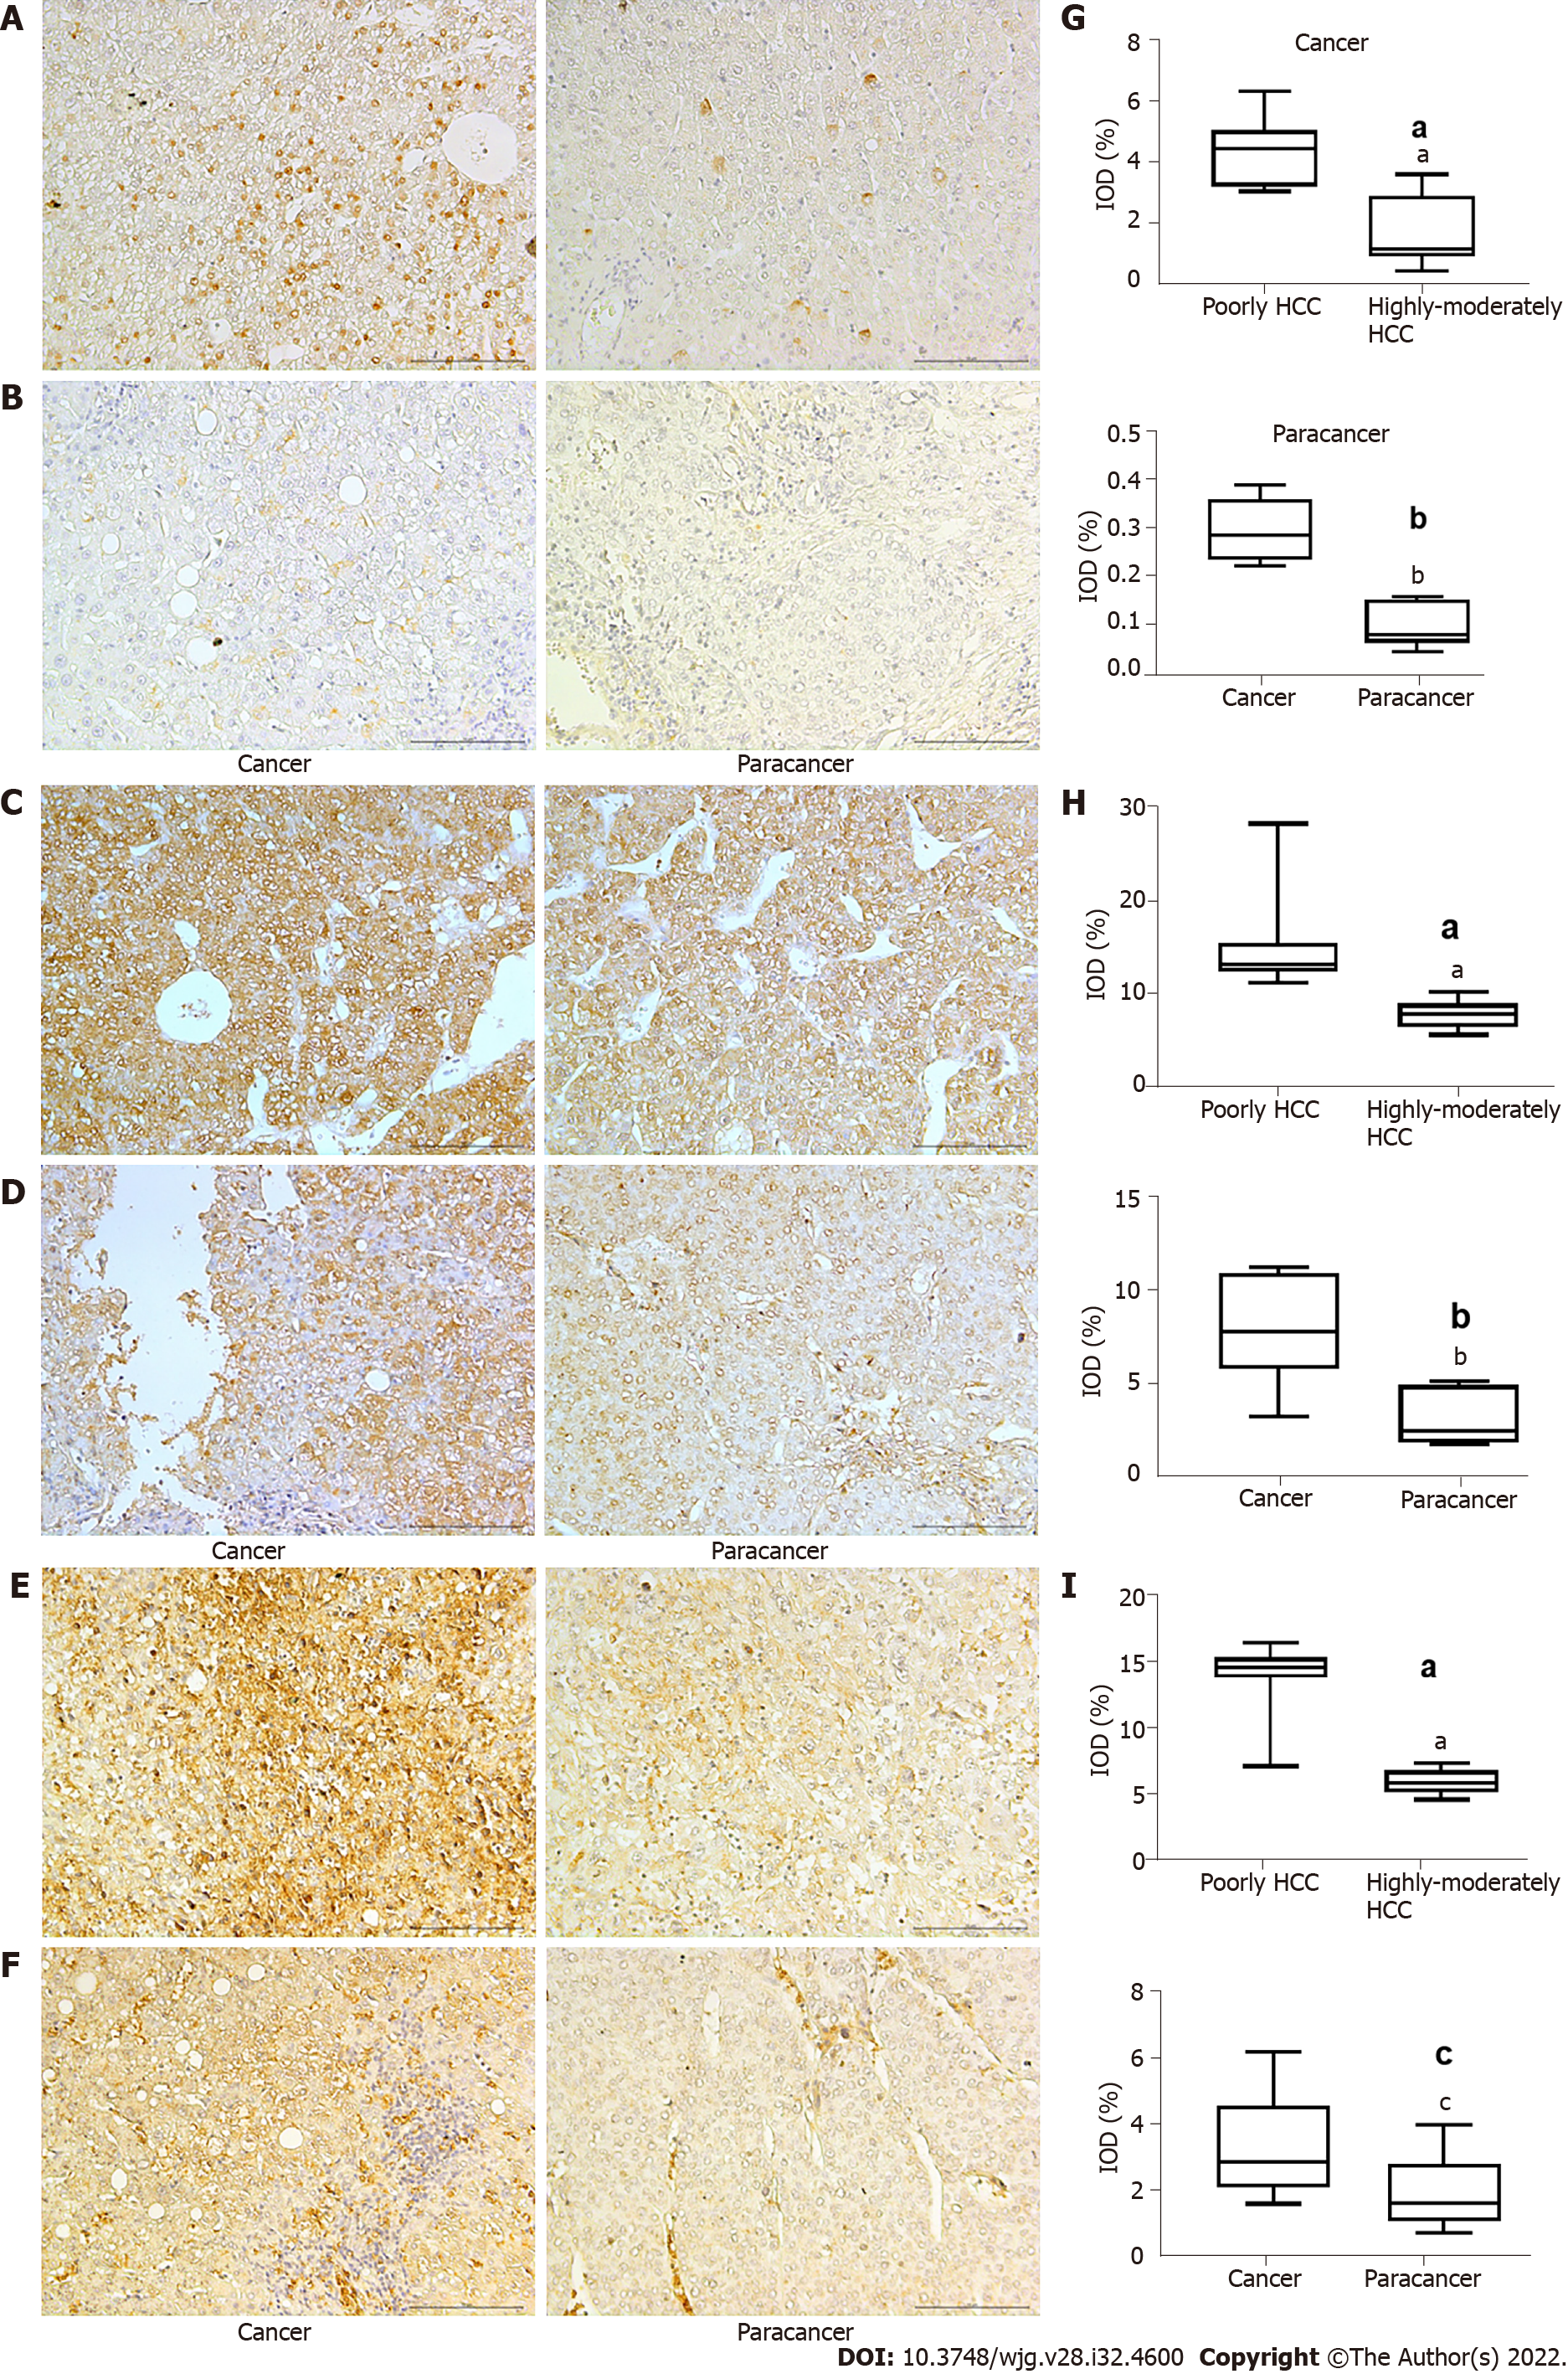
Figure 1 Expression of hypoxia inducible factor-1α, lactate dehydrogenase A, and glucose transporter 1 in hepatocellular carcinoma.
A and B: Expression of hypoxia inducible factor-1 (HIF-1α) in poorly (A) and highly-moderately differentiated hepatocellular carcinoma (HCC) (B); C and D: Expression of lactate dehydrogenase A (LDHA) in poorly (C) and highly-moderately differentiated HCC (D); E and F: Expression of glucose transporter 1 (GLUT1) in poorly (E) and highly-moderately differentiated HCC (F); F: Expression of GLUT1 in high-moderately HCC, (Magnification: 200 ×, scale bar 10 µm); G-I: Comparison of HIF-1α (G), LDHA (H), and GLUT1 (I) in different groups by t test. Magnification: 200 ×, scale bar = 10 µm. aP < 0.001 vs poorly differentiated HCC; bP < 0.001 vs cancer; cP < 0.05 vs cancer.
- Citation: Zhou L, Zhao Y, Pan LC, Wang J, Shi XJ, Du GS, He Q. Sirolimus increases the anti-cancer effect of Huai Er by regulating hypoxia inducible factor-1α-mediated glycolysis in hepatocellular carcinoma. World J Gastroenterol 2022; 28(32): 4600-4619
- URL: https://www.wjgnet.com/1007-9327/full/v28/i32/4600.htm
- DOI: https://dx.doi.org/10.3748/wjg.v28.i32.4600


