Copyright
©The Author(s) 2022.
World J Gastroenterol. Aug 21, 2022; 28(31): 4399-4416
Published online Aug 21, 2022. doi: 10.3748/wjg.v28.i31.4399
Published online Aug 21, 2022. doi: 10.3748/wjg.v28.i31.4399
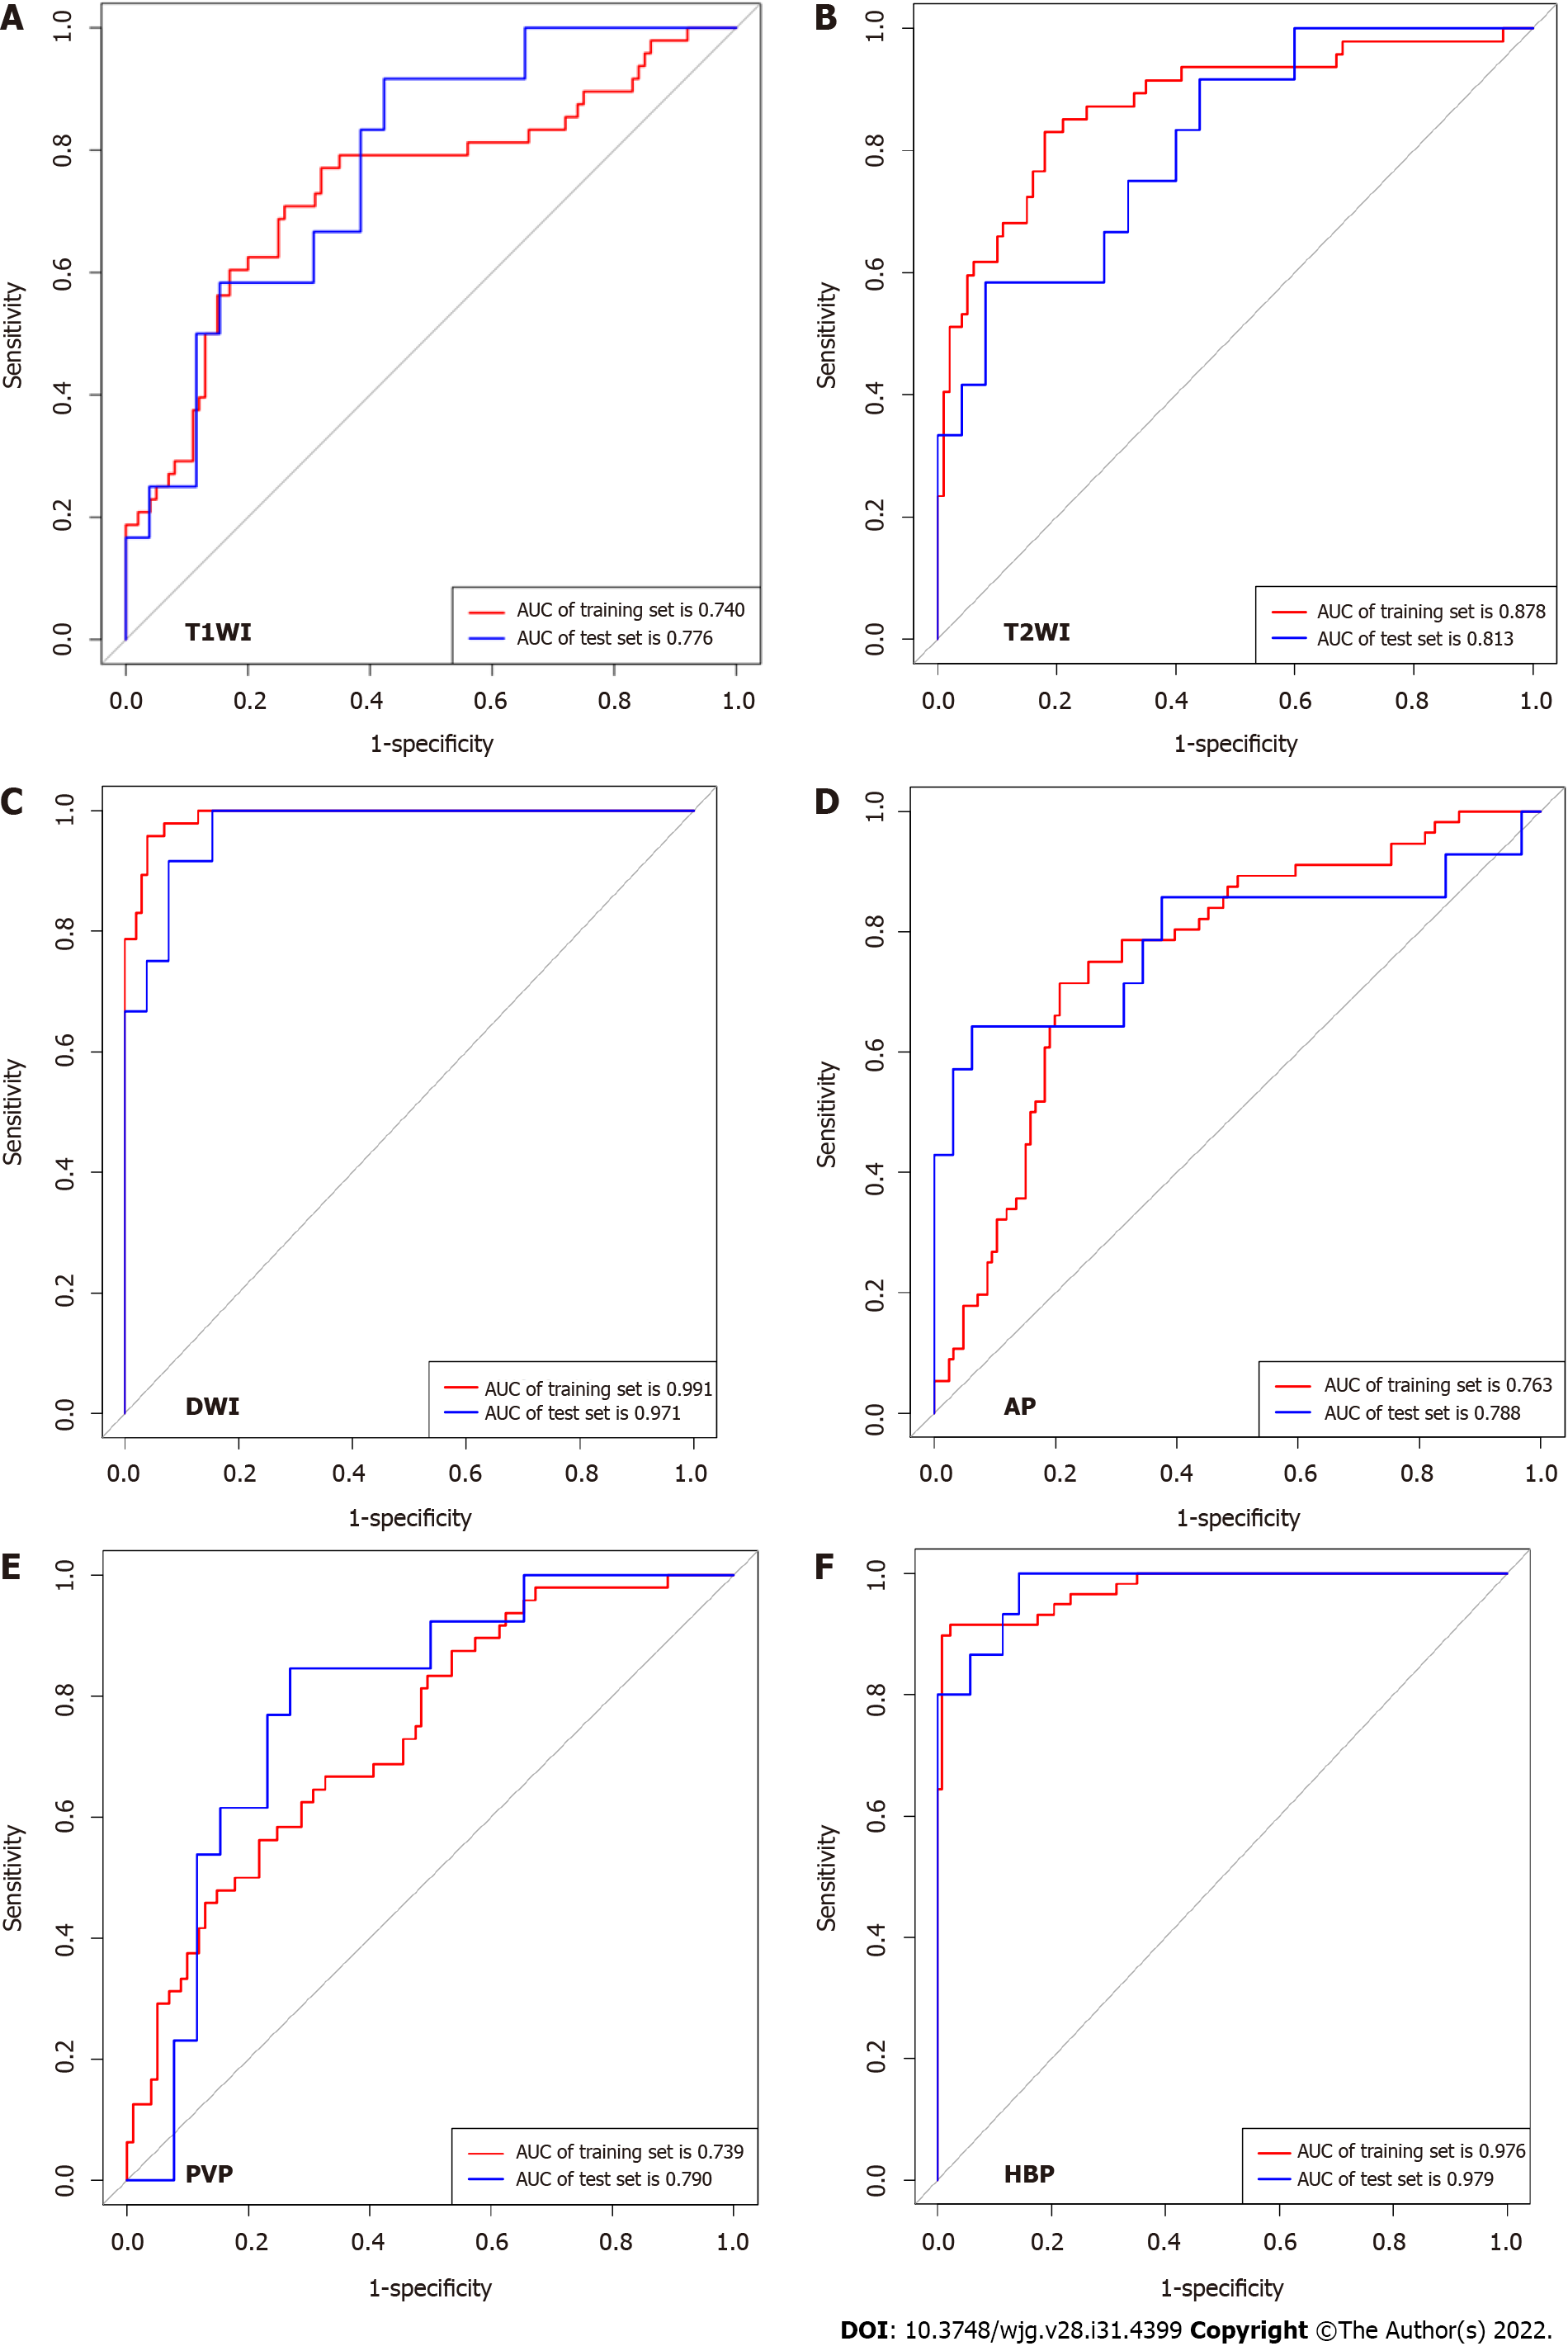
Figure 3 Receiver operating characteristic curve of different radiomics models for diagnosis microvascular invasion in small hepato
- Citation: Chen YD, Zhang L, Zhou ZP, Lin B, Jiang ZJ, Tang C, Dang YW, Xia YW, Song B, Long LL. Radiomics and nomogram of magnetic resonance imaging for preoperative prediction of microvascular invasion in small hepatocellular carcinoma. World J Gastroenterol 2022; 28(31): 4399-4416
- URL: https://www.wjgnet.com/1007-9327/full/v28/i31/4399.htm
- DOI: https://dx.doi.org/10.3748/wjg.v28.i31.4399


