Copyright
©The Author(s) 2022.
World J Gastroenterol. Aug 21, 2022; 28(31): 4328-4337
Published online Aug 21, 2022. doi: 10.3748/wjg.v28.i31.4328
Published online Aug 21, 2022. doi: 10.3748/wjg.v28.i31.4328
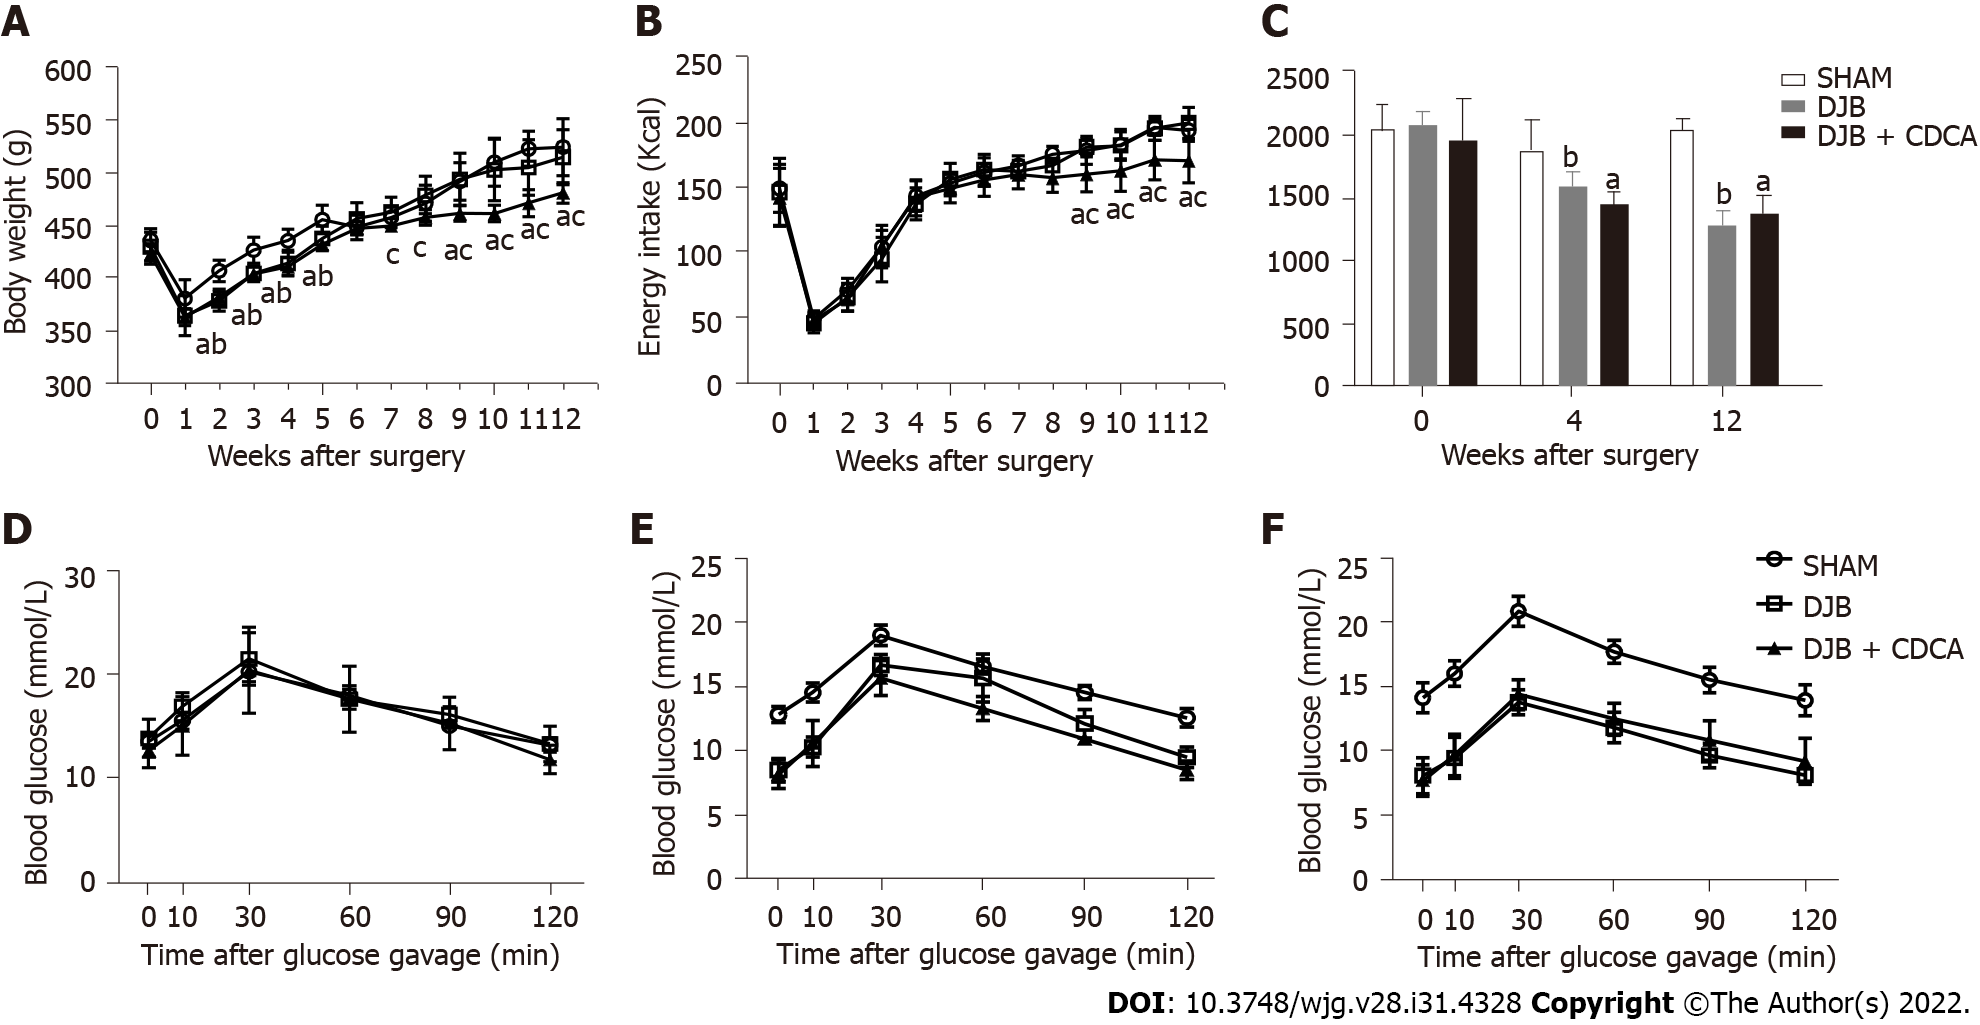
Figure 1 Body weight and energy intake from baseline to week 12 after operations as well as oral glucose tolerance test and the corresponding areas under the curves at baseline, week 4 and week 12 after operations.
A: Body weight; B: Energy intake; C: Area under the curve of oral glucose tolerance test; D: Oral glucose tolerance test at baseline; E: Oral glucose tolerance test at week 4; F: Oral glucose tolerance test at week 12. aP < 0.05, salicylhydroxamic acid vs duodenal-jejunal bypass + chenodeoxycholic acid; bP < 0.05, salicylhydroxamic acid vs duodenal-jejunal bypass. SHAM: Salicylhydroxamic acid; DJB: Duodenal-jejunal bypass; CDCA: Chenodeoxycholic acid.
- Citation: Cheng ZQ, Liu TM, Ren PF, Chen C, Wang YL, Dai Y, Zhang X. Duodenal-jejunal bypass reduces serum ceramides via inhibiting intestinal bile acid-farnesoid X receptor pathway. World J Gastroenterol 2022; 28(31): 4328-4337
- URL: https://www.wjgnet.com/1007-9327/full/v28/i31/4328.htm
- DOI: https://dx.doi.org/10.3748/wjg.v28.i31.4328


