Copyright
©The Author(s) 2022.
World J Gastroenterol. Jan 21, 2022; 28(3): 365-380
Published online Jan 21, 2022. doi: 10.3748/wjg.v28.i3.365
Published online Jan 21, 2022. doi: 10.3748/wjg.v28.i3.365
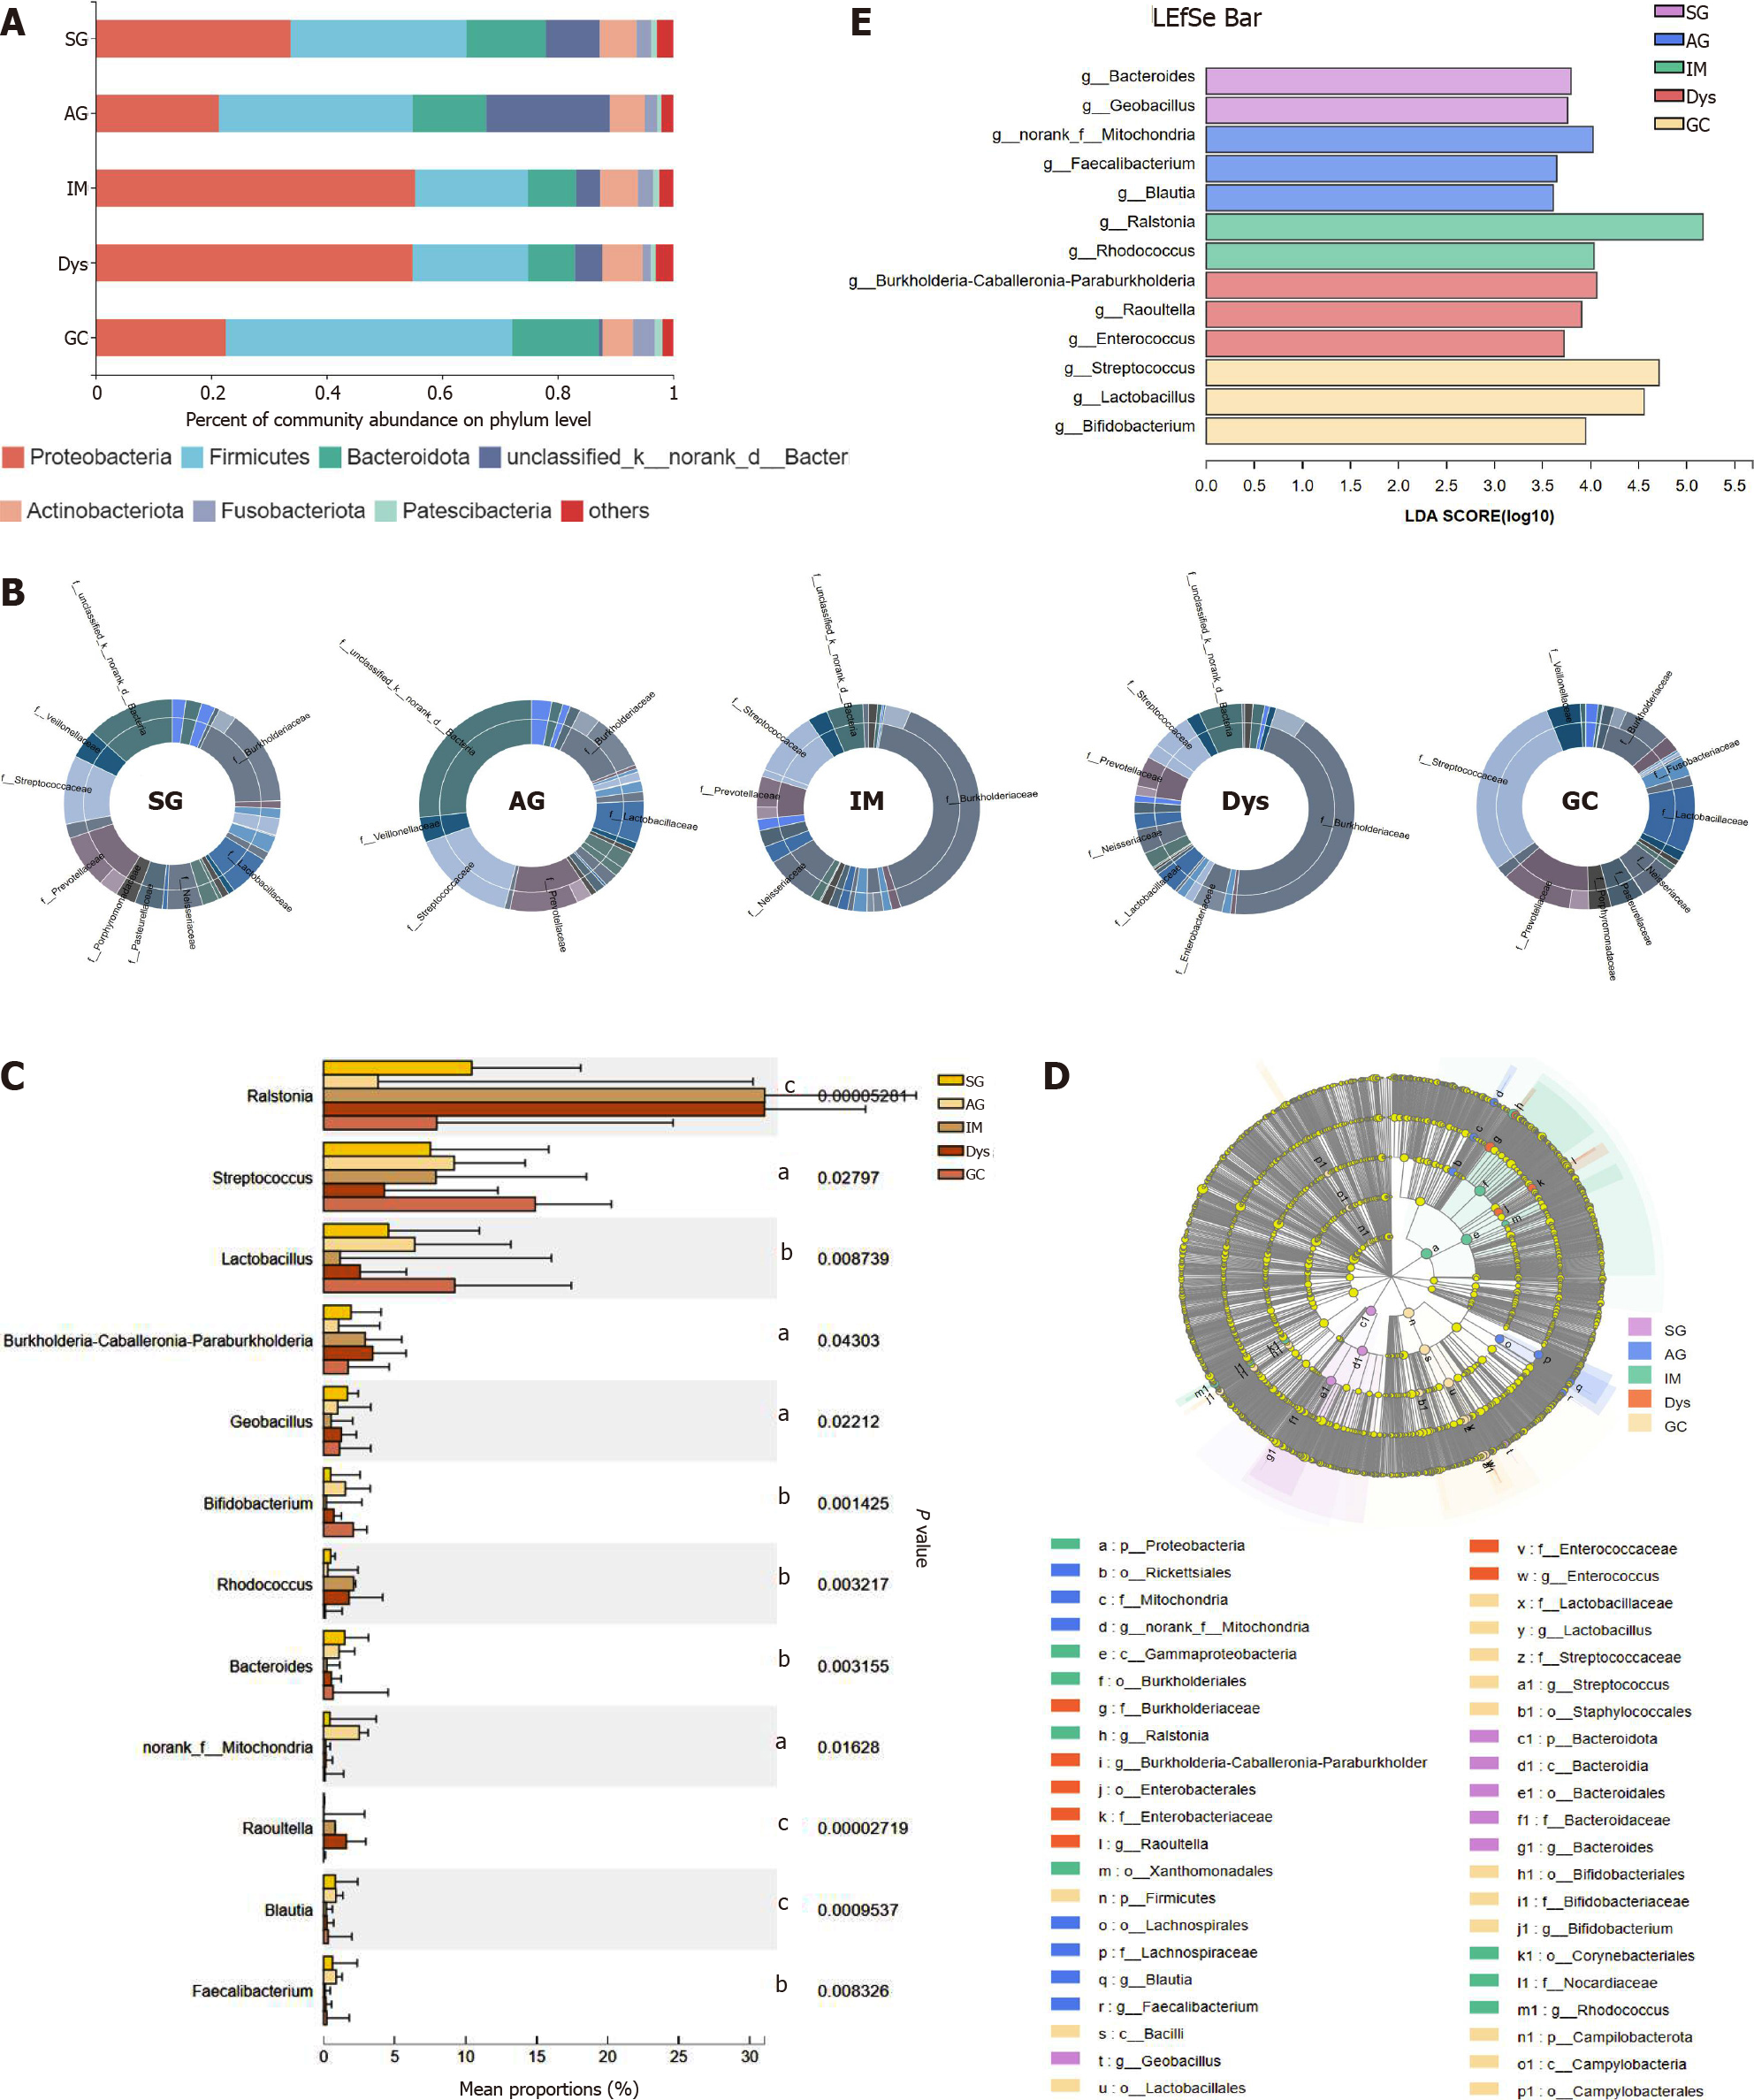
Figure 2 The mucosa microbiota composition in different groups.
A: Relative abundance of phyla in five groups; B: Community analysis sunburst plot on family level; C: Changes in the gastric mucosa microbiota from superficial gastritis, through atrophic gastritis, intestinal metaplasia, dysplasia to gastric cancer; D: Linear discriminant analysis effect size (LEfSe) analysis from phylum to genus; E: Histogram of LEfSe analysis at the genus level. Significance was obtained by LEfSe (Kruskal–Wallis test) at P < 0.05, and linear discriminant analysis score>3.5. aP < 0.05; bP < 0.01; cP < 0.001. LDA: Linear discriminant analysis; LEfSe: LDA effect size; SG: Superficial gastritis; AG: Atrophic gastritis; IM: Intestinal metaplasia; Dys: Dysplasia; GC: Gastric cancer.
- Citation: Sun QH, Zhang J, Shi YY, Zhang J, Fu WW, Ding SG. Microbiome changes in the gastric mucosa and gastric juice in different histological stages of Helicobacter pylori-negative gastric cancers. World J Gastroenterol 2022; 28(3): 365-380
- URL: https://www.wjgnet.com/1007-9327/full/v28/i3/365.htm
- DOI: https://dx.doi.org/10.3748/wjg.v28.i3.365


