Copyright
©The Author(s) 2022.
World J Gastroenterol. Jul 28, 2022; 28(28): 3644-3665
Published online Jul 28, 2022. doi: 10.3748/wjg.v28.i28.3644
Published online Jul 28, 2022. doi: 10.3748/wjg.v28.i28.3644
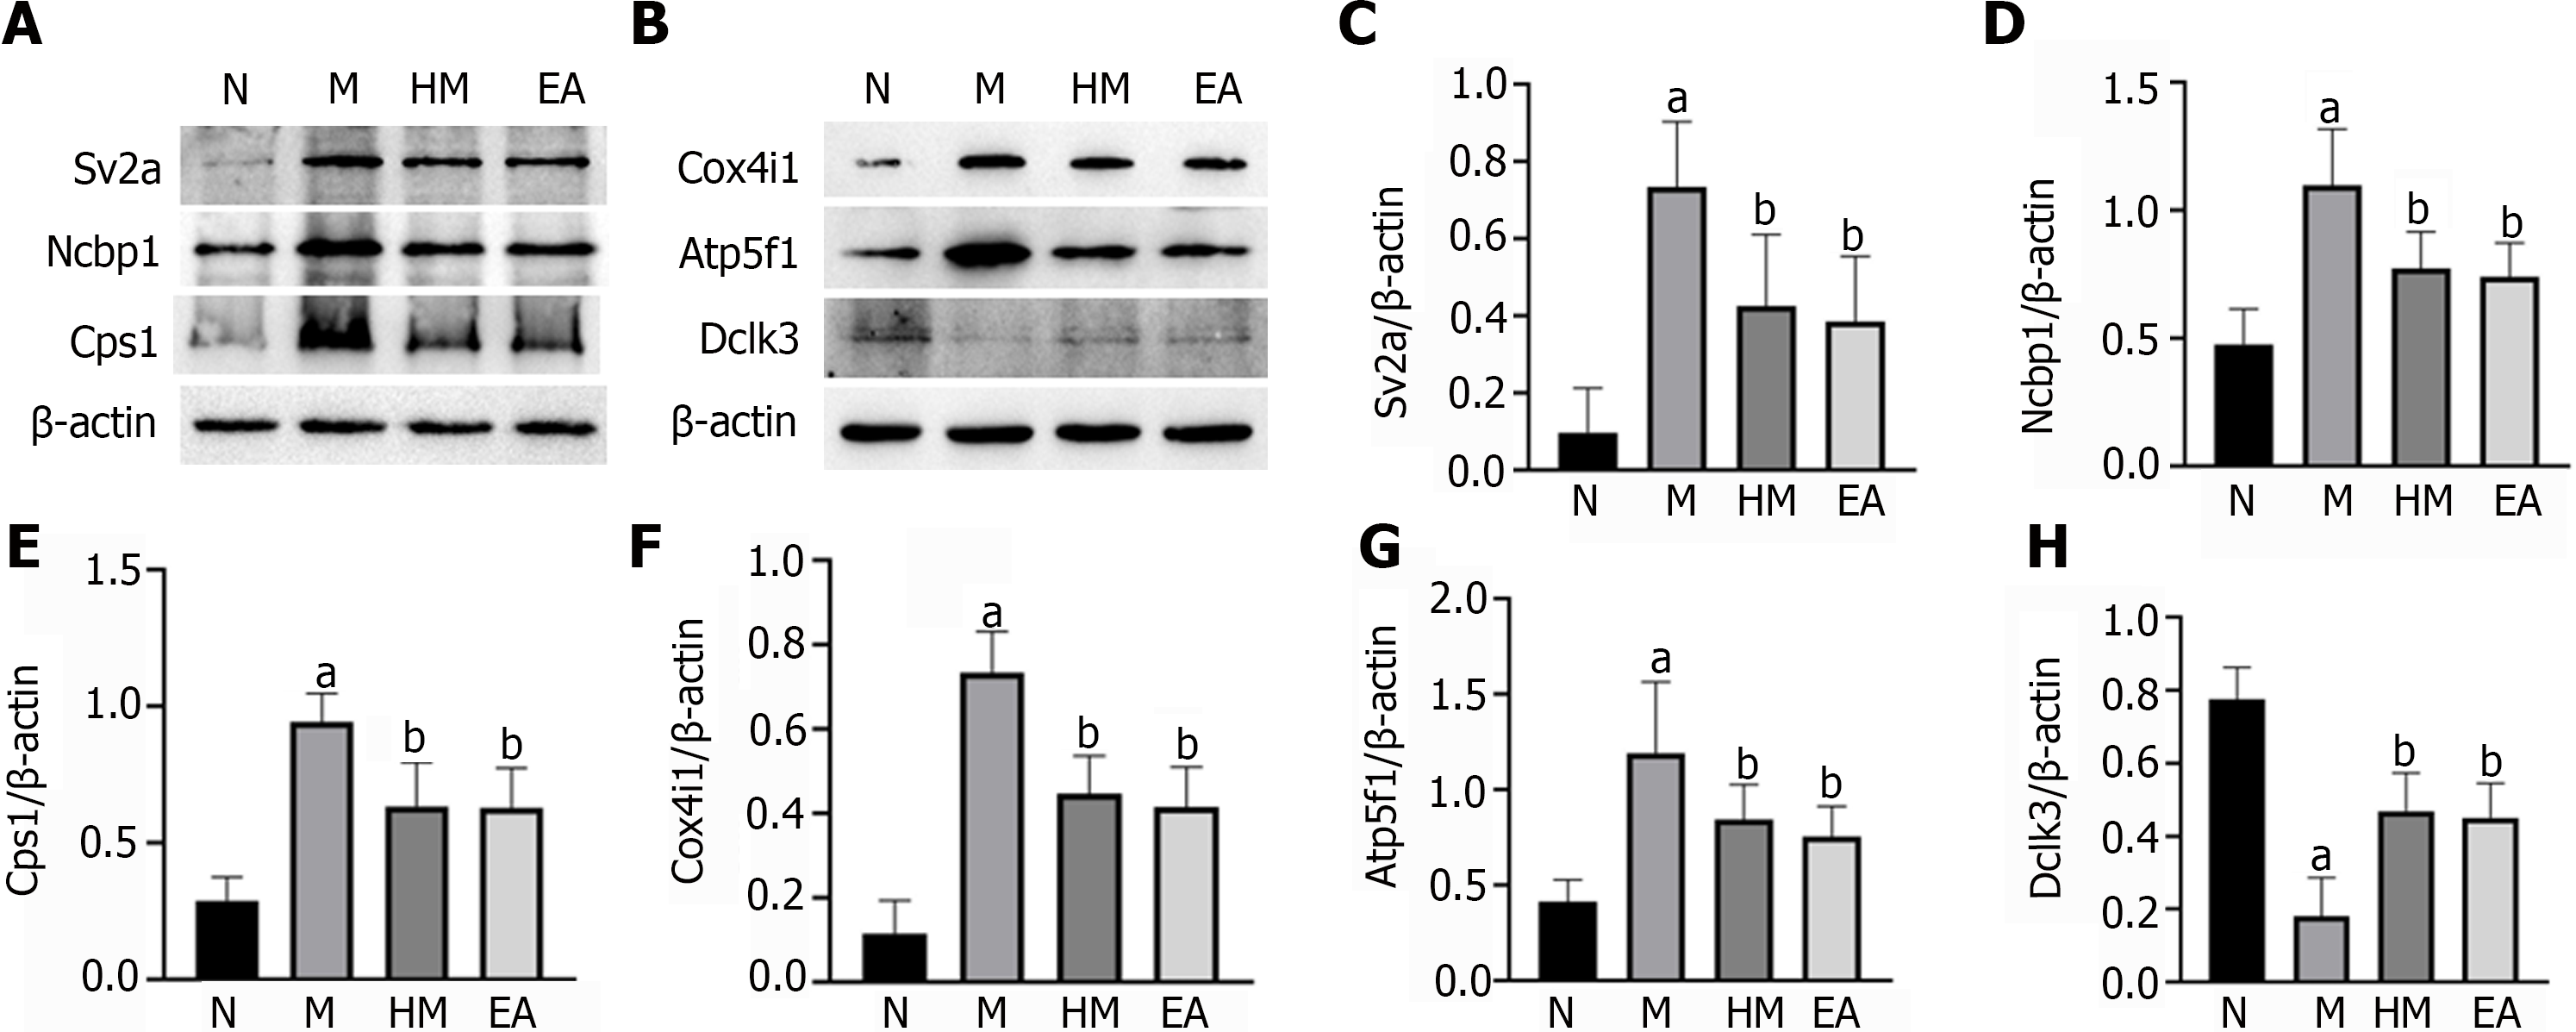
Figure 9 Verification of differentially expressed proteins expressions by western blot.
A and B: Band diagrams of protein expressions. All data are expressed as mean ± SD; C: Synaptic vesicle glycoprotein 2A; D: Nuclear cap binding protein subunit 1; E: Carbamoyl phosphate synthetase 1; F: Cytochrome c oxidase subunit 4 isoform 1; G: ATP synthase beta subunit precursor 1; H: Doublecortin like kinase 3. aP < 0.01 vs normal group; bP < 0.01 vs dextran sulfate sodium-induced ulcerative colitis model group. N: Normal group; M: Dextran sulfate sodium-induced ulcerative colitis model group; HM: Herb-partitioned moxibustion group; EA: Electroacupuncture group; Sv2a: Synaptic vesicle glycoprotein 2A; Ncbp1: Nuclear cap binding protein subunit 1; Cps1: Carbamoyl phosphate synthetase 1; Cox4i1: Cytochrome c oxidase subunit 4 isoform 1; Atp5f1: ATP synthase beta subunit precursor; Dclk3: Doublecortin like kinase 3.
- Citation: Qi Q, Zhong R, Liu YN, Zhao C, Huang Y, Lu Y, Ma Z, Zheng HD, Wu LY. Mechanism of electroacupuncture and herb-partitioned moxibustion on ulcerative colitis animal model: A study based on proteomics. World J Gastroenterol 2022; 28(28): 3644-3665
- URL: https://www.wjgnet.com/1007-9327/full/v28/i28/3644.htm
- DOI: https://dx.doi.org/10.3748/wjg.v28.i28.3644


