Copyright
©The Author(s) 2022.
World J Gastroenterol. Jul 21, 2022; 28(27): 3455-3475
Published online Jul 21, 2022. doi: 10.3748/wjg.v28.i27.3455
Published online Jul 21, 2022. doi: 10.3748/wjg.v28.i27.3455
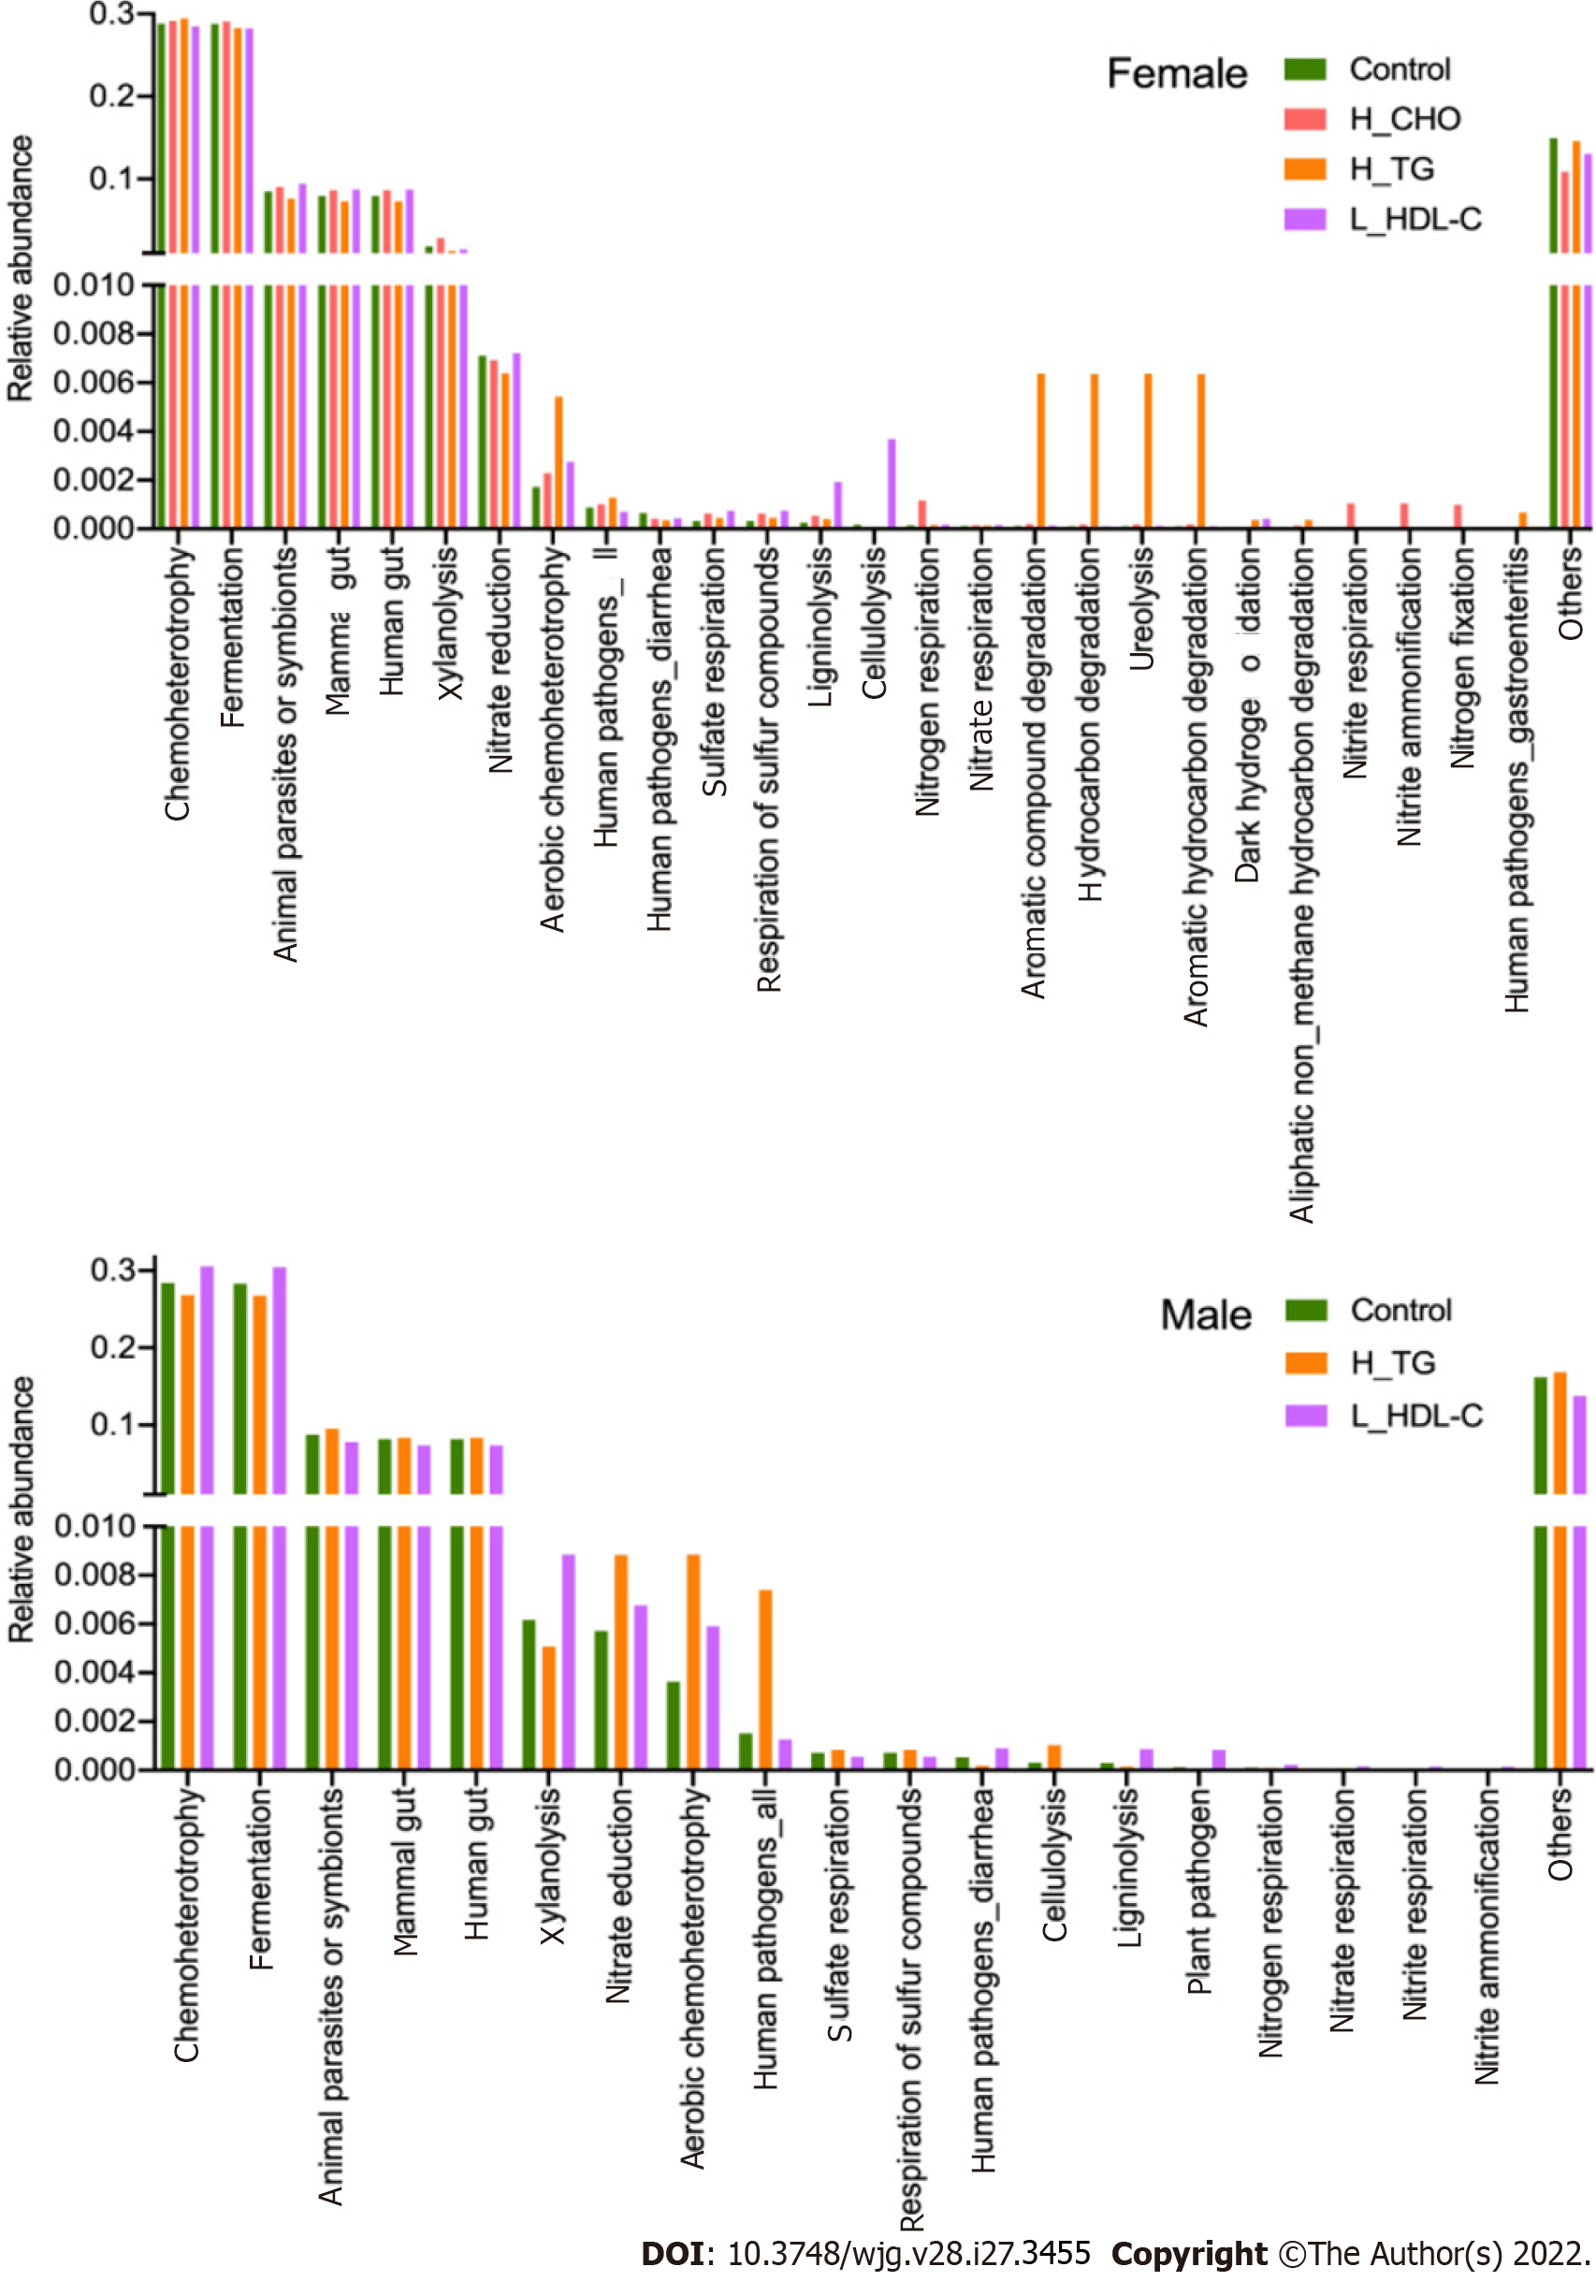
Figure 10 The main functional annotations of gut microbiota in the study population.
Bar plots show the relative abundances of top twenty annotated functions with higher relative abundances in female subgroups and male subgroups, respectively, using the FAPROTAX database. H_CHO: High total cholesterol; H_TG: high triglyceride; L_HDL-C: Low high-density lipoprotein cholesterol.
- Citation: Guo L, Wang YY, Wang JH, Zhao HP, Yu Y, Wang GD, Dai K, Yan YZ, Yang YJ, Lv J. Associations of gut microbiota with dyslipidemia based on sex differences in subjects from Northwestern China. World J Gastroenterol 2022; 28(27): 3455-3475
- URL: https://www.wjgnet.com/1007-9327/full/v28/i27/3455.htm
- DOI: https://dx.doi.org/10.3748/wjg.v28.i27.3455


