Copyright
©The Author(s) 2022.
World J Gastroenterol. Jul 14, 2022; 28(26): 3164-3176
Published online Jul 14, 2022. doi: 10.3748/wjg.v28.i26.3164
Published online Jul 14, 2022. doi: 10.3748/wjg.v28.i26.3164
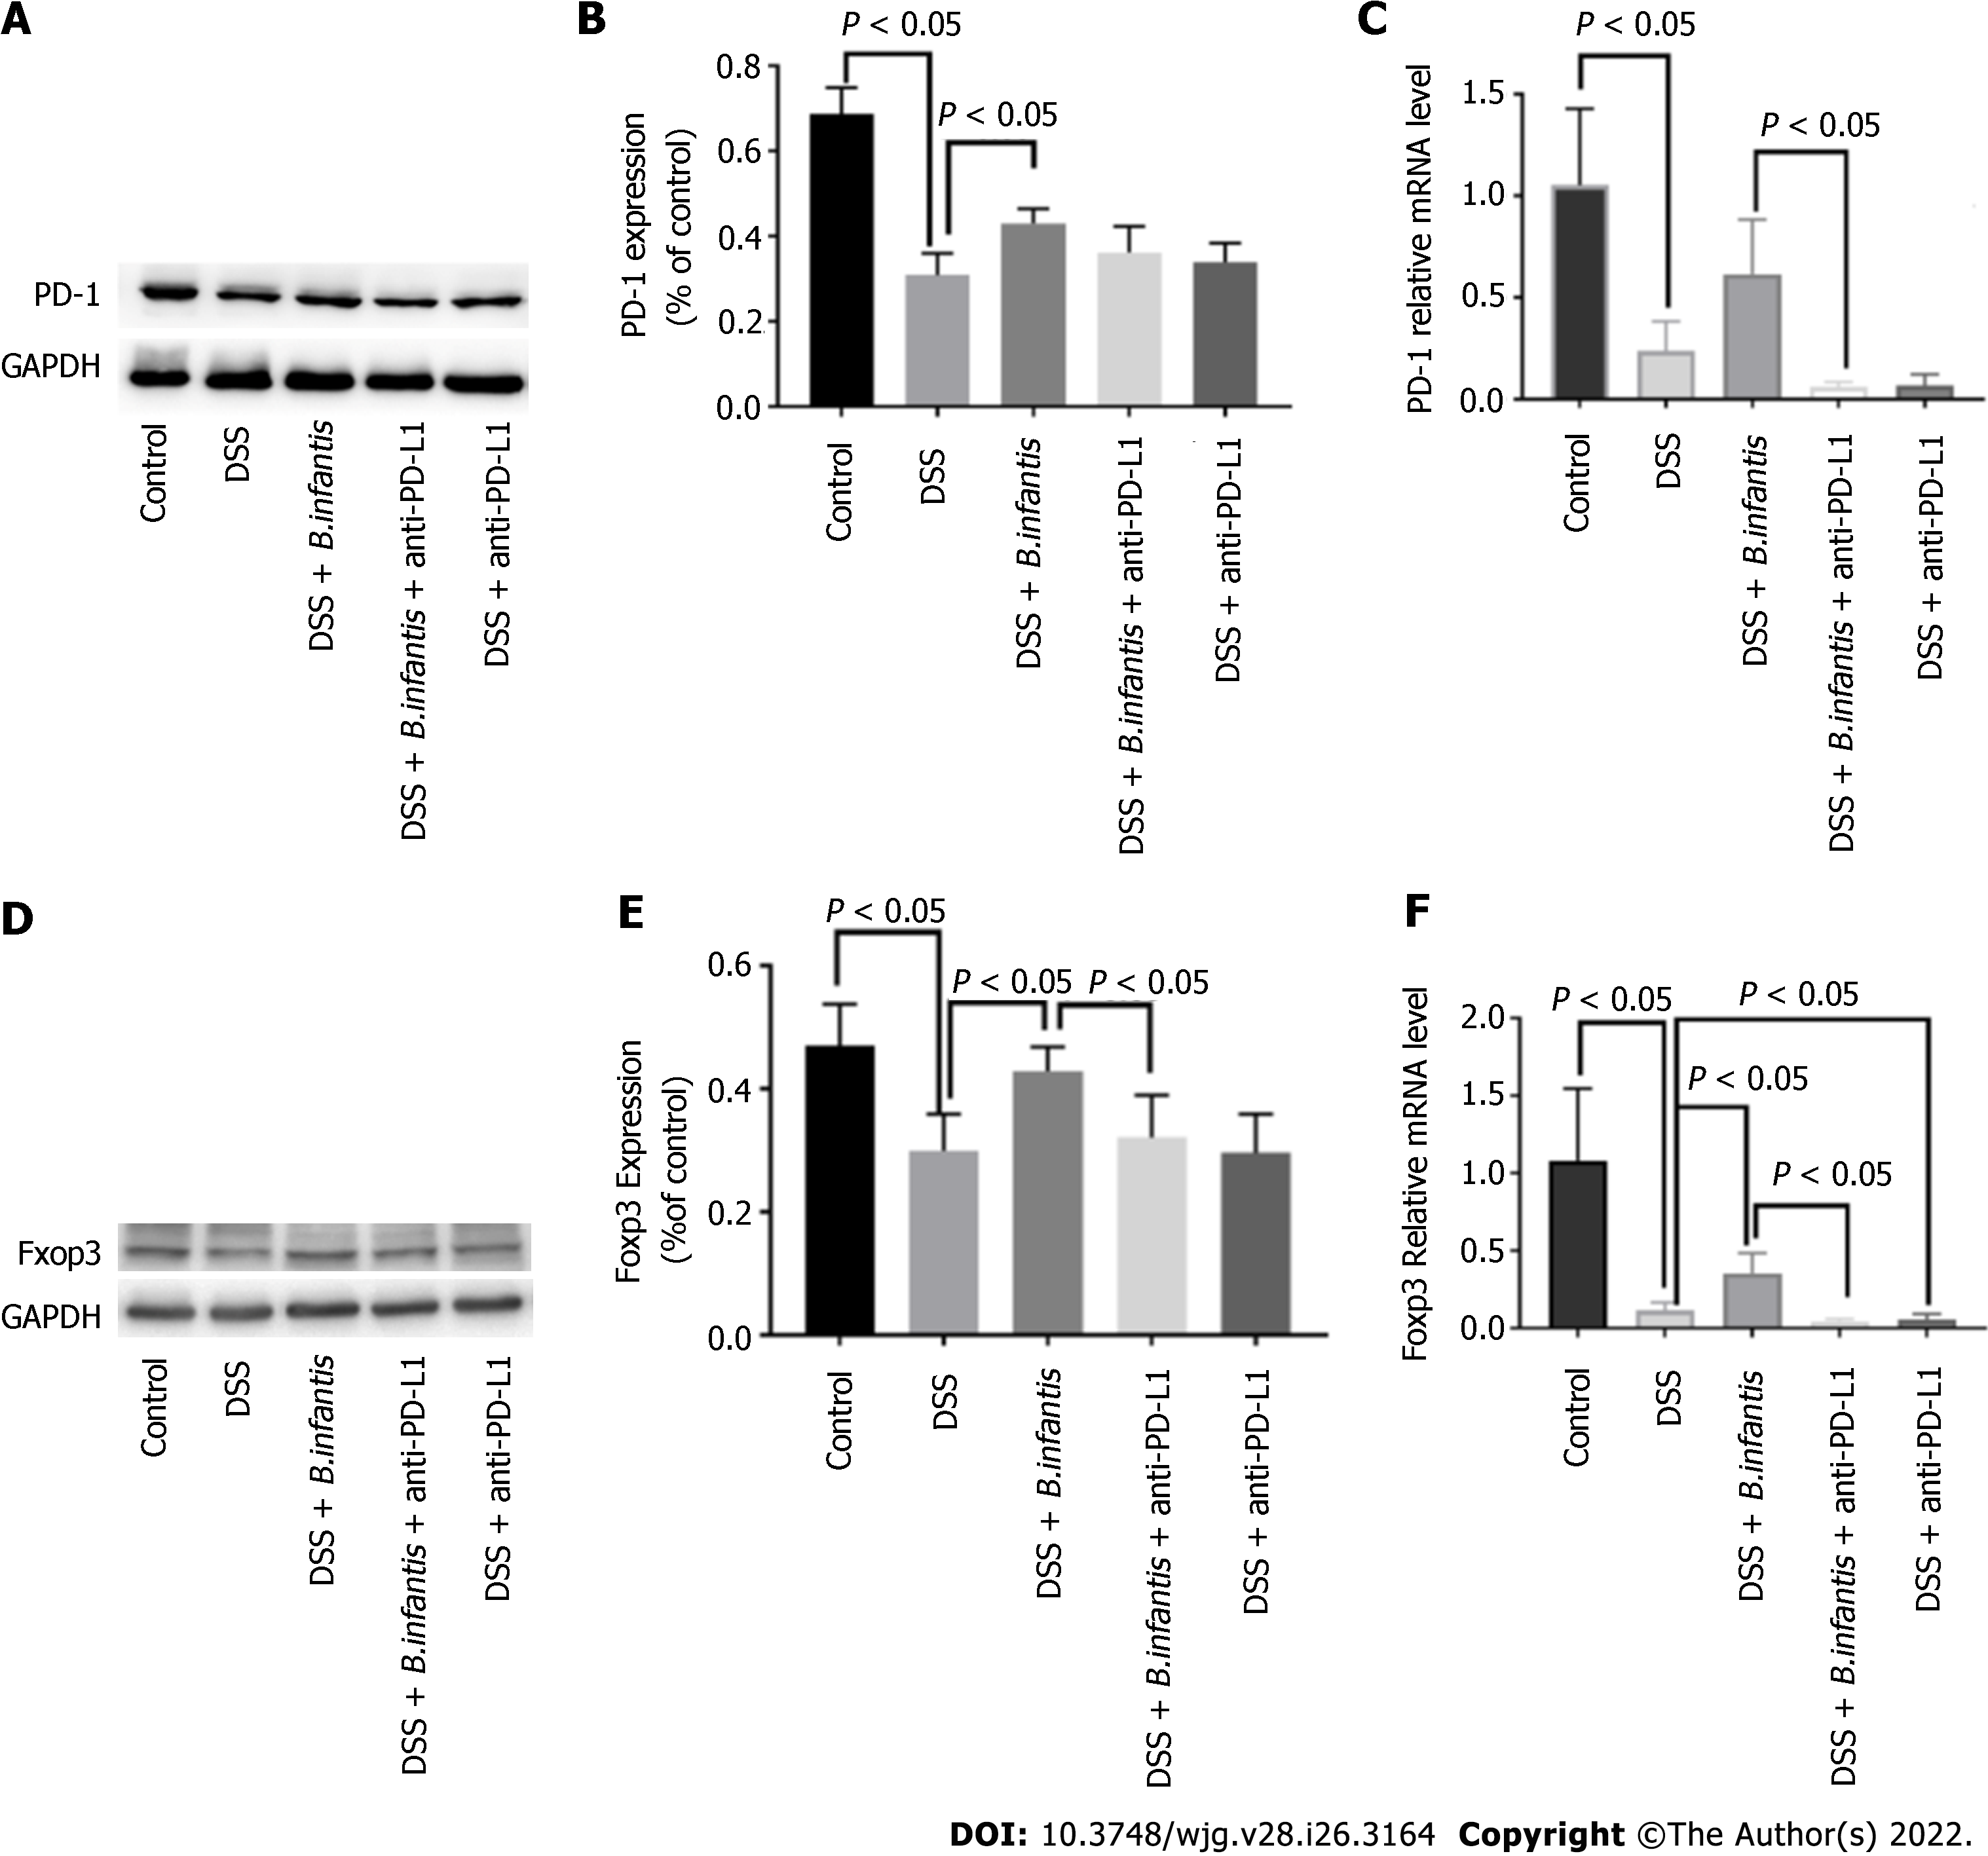
Figure 1 The effects of blocking programmed cell death ligand.
A: Expression of programmed cell death 1 (PD-1) protein; B: Statistical chart showing the differences in PD-1 protein expression; C: Statistical map showing the differences in PD-1 mRNA expression; D: Western blot showing forkhead box protein 3 protein (Foxp3) expression; E: Statistical chart showing the differences in Foxp3 expression; F: Statistical map showing the differences in Foxp3 mRNA levels. Data are presented as mean ± SD, and comparisons between groups were analyzed by one-way analysis of variance. Statistical significance was set as P < 0.05. PD-1: Programmed cell death 1; PD-L1: Programmed cell death ligand; GAPDH: Glyceraldehyde-3-phosphate dehydrogenase; DSS: Dextran sulfate sodium; B. infantis: Bifidobacterium infantis; Foxp3: Forkhead box protein 3.
- Citation: Zhou LY, Xie Y, Li Y. Bifidobacterium infantis regulates the programmed cell death 1 pathway and immune response in mice with inflammatory bowel disease. World J Gastroenterol 2022; 28(26): 3164-3176
- URL: https://www.wjgnet.com/1007-9327/full/v28/i26/3164.htm
- DOI: https://dx.doi.org/10.3748/wjg.v28.i26.3164


