Copyright
©The Author(s) 2022.
World J Gastroenterol. Jul 14, 2022; 28(26): 3008-3026
Published online Jul 14, 2022. doi: 10.3748/wjg.v28.i26.3008
Published online Jul 14, 2022. doi: 10.3748/wjg.v28.i26.3008
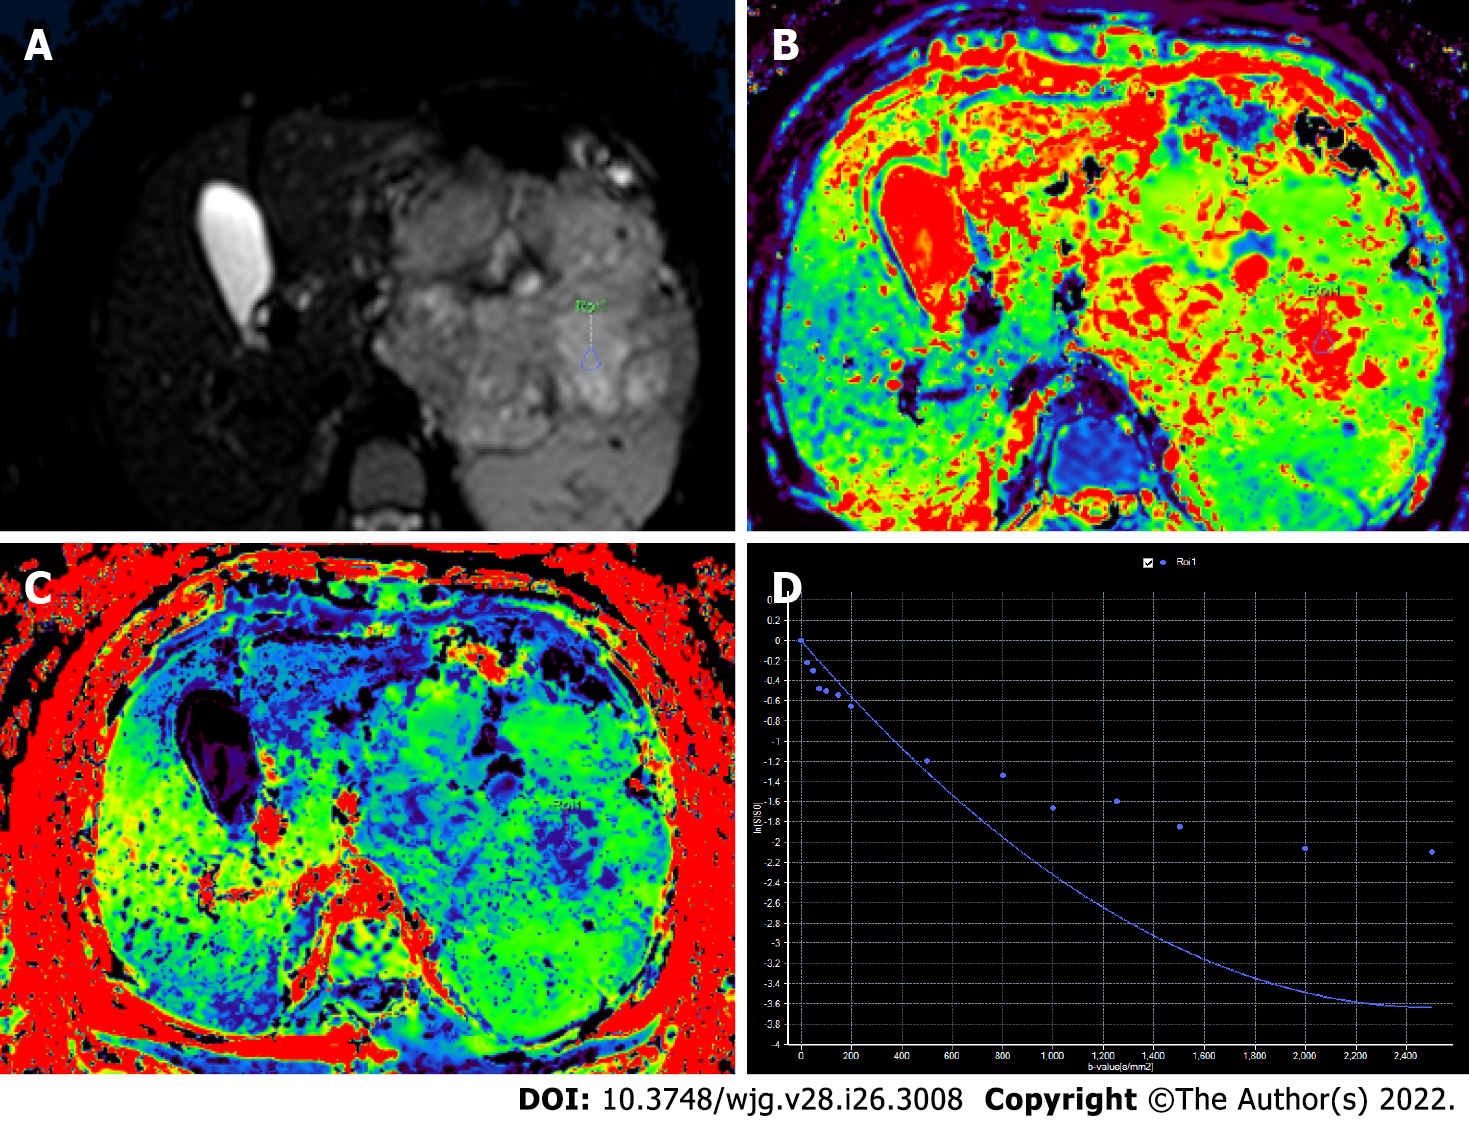
Figure 9 Diffusion kurtosis of the lesion same as in Figure 8.
A: Axial diffusion-weighted image (b = 200 s/mm2) with region of interest marked; B: Diffusion map (D = 3 × 103 mm2/s); C: Kurtosis map (k = 0.40); D: Signal decay curve shows non-Gaussian diffusion.
- Citation: Ramachandran A, Madhusudhan KS. Advances in the imaging of gastroenteropancreatic neuroendocrine neoplasms. World J Gastroenterol 2022; 28(26): 3008-3026
- URL: https://www.wjgnet.com/1007-9327/full/v28/i26/3008.htm
- DOI: https://dx.doi.org/10.3748/wjg.v28.i26.3008


