Copyright
©The Author(s) 2022.
World J Gastroenterol. Jul 14, 2022; 28(26): 3008-3026
Published online Jul 14, 2022. doi: 10.3748/wjg.v28.i26.3008
Published online Jul 14, 2022. doi: 10.3748/wjg.v28.i26.3008
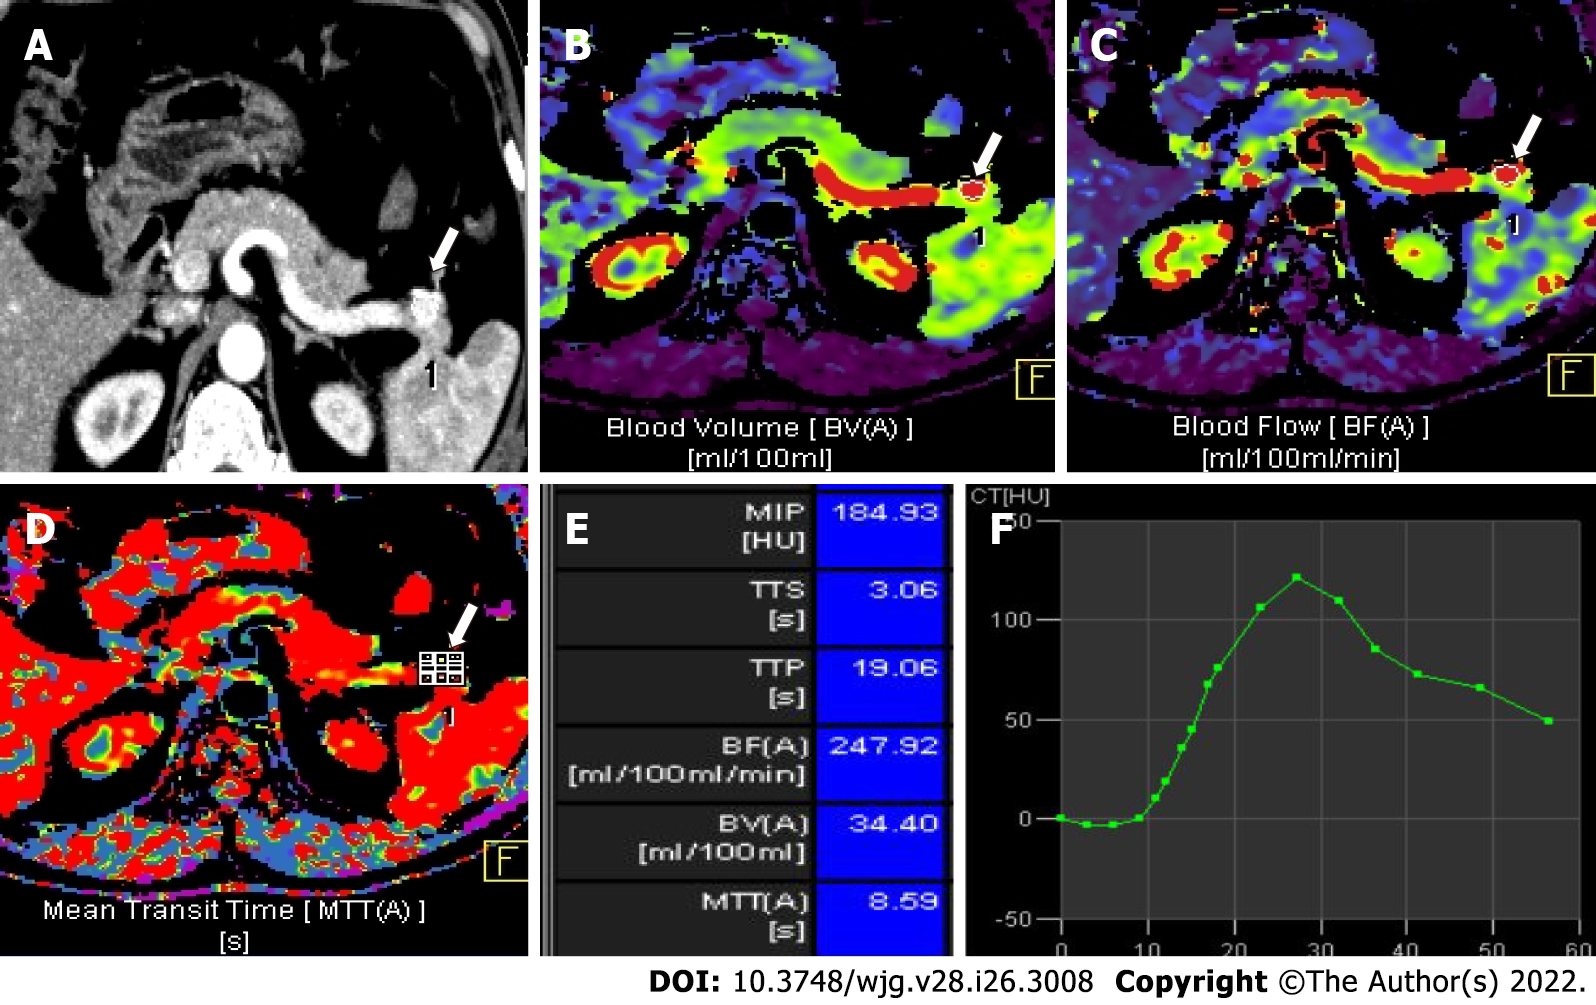
Figure 4 Volume perfusion computed tomography images of a 56-year-old man with recurrent hyperinsulinemic hypoglycemia.
A: Axial pancreatic phase computed tomography image shows a hyperenhancing lesion in the pancreatic tail (arrow); B-D: Color-coded parametric maps for blood volume (B), blood flow (C) and mean transit time (D) of the tumor (arrow) and normal pancreatic tissue; E: Chart shows mean value of each perfusion parameter of the tumor. Blood flow in the tumor was higher (247 mL/100 mL/min) compared to normal pancreatic parenchyma (72 mL/100 mL/min); F: Time attenuation curve shows dynamic enhancement pattern of the tumor corresponding to transient hyperenhancement. Histopathology after enucleation proved the tumor to be grade 1 insulinoma.
- Citation: Ramachandran A, Madhusudhan KS. Advances in the imaging of gastroenteropancreatic neuroendocrine neoplasms. World J Gastroenterol 2022; 28(26): 3008-3026
- URL: https://www.wjgnet.com/1007-9327/full/v28/i26/3008.htm
- DOI: https://dx.doi.org/10.3748/wjg.v28.i26.3008


