Copyright
©The Author(s) 2022.
World J Gastroenterol. Jun 14, 2022; 28(22): 2494-2508
Published online Jun 14, 2022. doi: 10.3748/wjg.v28.i22.2494
Published online Jun 14, 2022. doi: 10.3748/wjg.v28.i22.2494
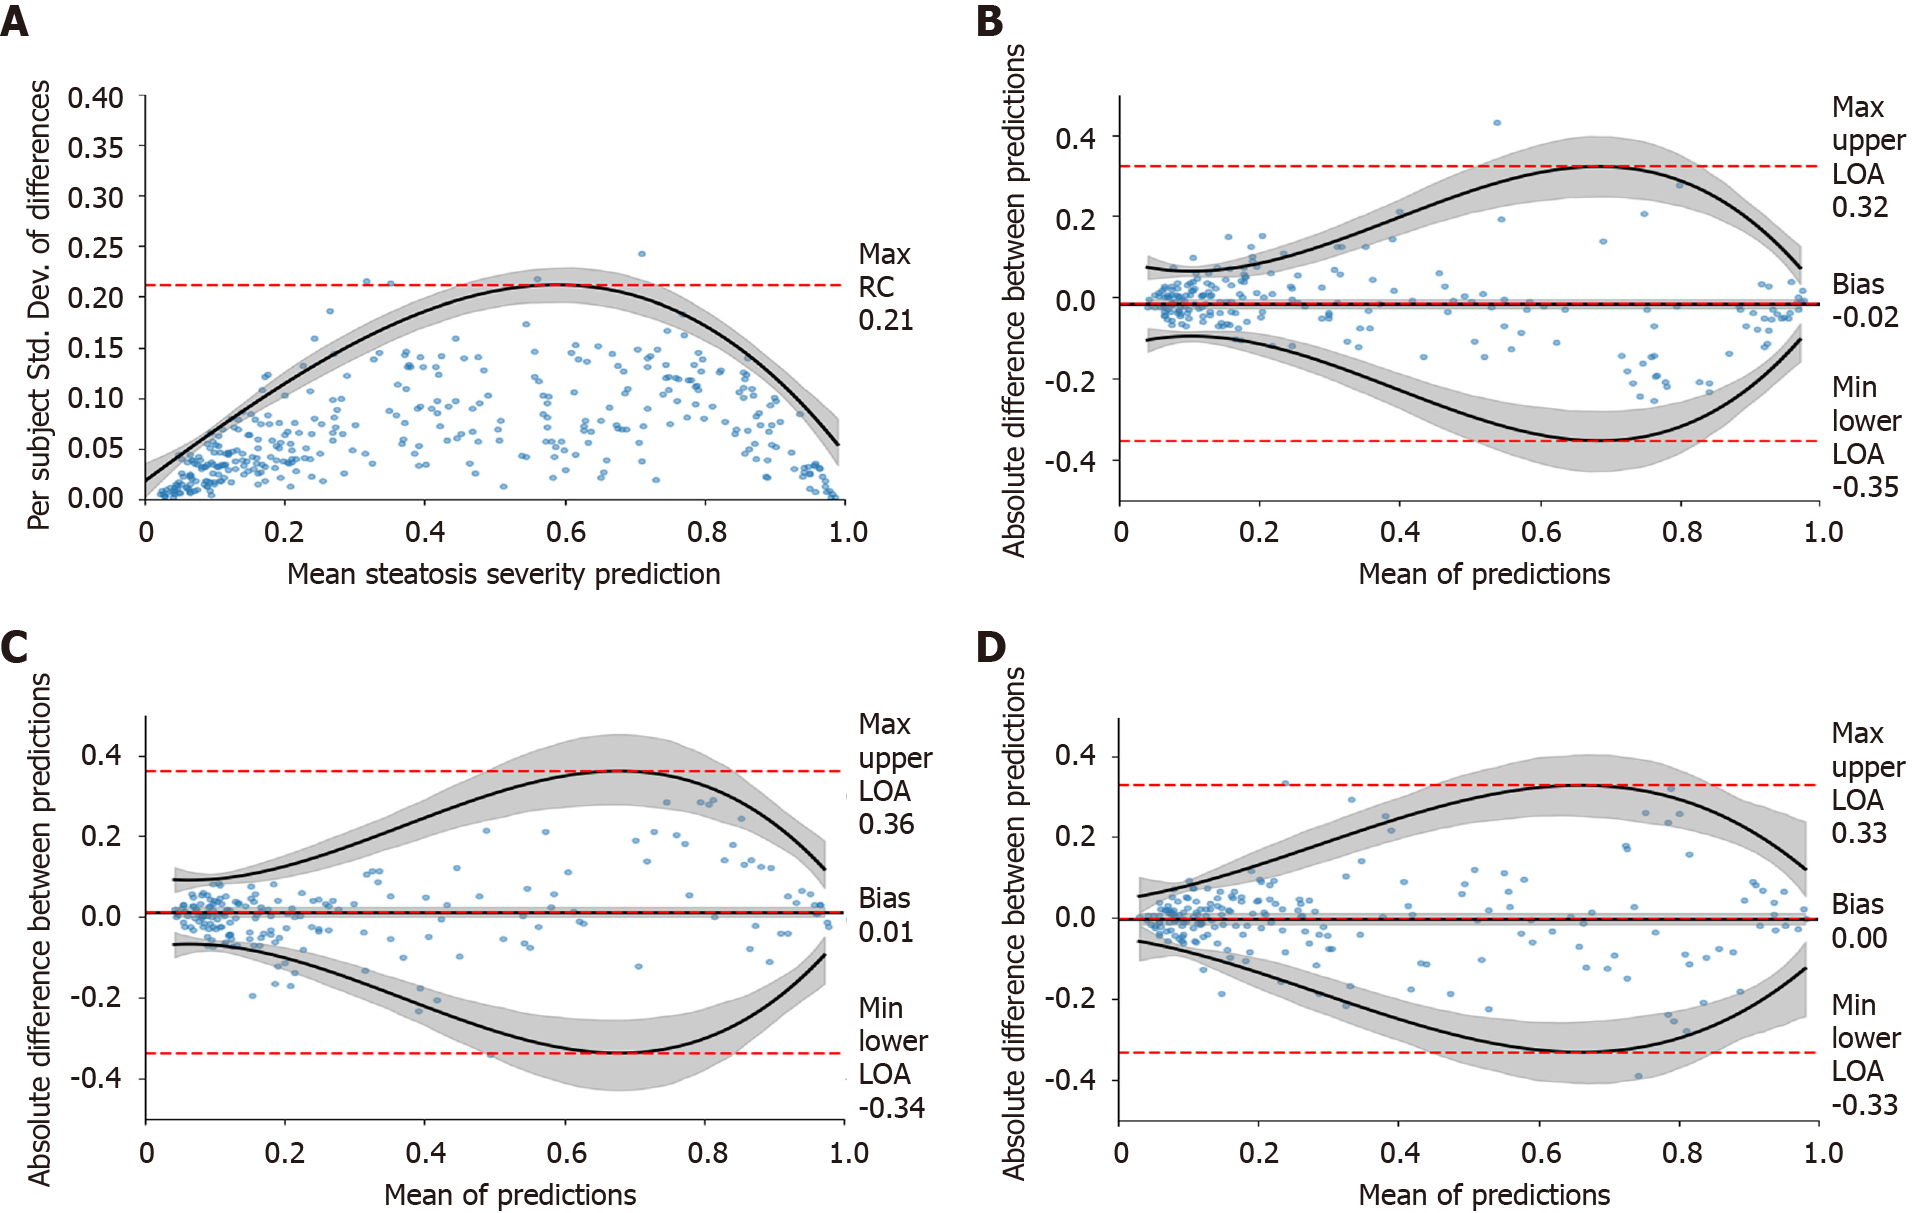
Figure 4 Repeatability study.
A: A repeatability coefficient plot for right liver lobe when using three images; B-D: Cross-scanner Bland-Altman plots for Siemens-Toshiba (B), Toshiba-Philips (C), and Philips-Siemens (D), respectively. Cross-scanner plots were depicted for “All View Groups” when using ≥ three images per view group. Grey-shaded areas indicate 95% confidence intervals. RC: Repeatability coefficient; LOA: Limit of agreement.
- Citation: Li B, Tai DI, Yan K, Chen YC, Chen CJ, Huang SF, Hsu TH, Yu WT, Xiao J, Le L, Harrison AP. Accurate and generalizable quantitative scoring of liver steatosis from ultrasound images via scalable deep learning. World J Gastroenterol 2022; 28(22): 2494-2508
- URL: https://www.wjgnet.com/1007-9327/full/v28/i22/2494.htm
- DOI: https://dx.doi.org/10.3748/wjg.v28.i22.2494


