Copyright
©The Author(s) 2022.
World J Gastroenterol. Jun 14, 2022; 28(22): 2437-2456
Published online Jun 14, 2022. doi: 10.3748/wjg.v28.i22.2437
Published online Jun 14, 2022. doi: 10.3748/wjg.v28.i22.2437
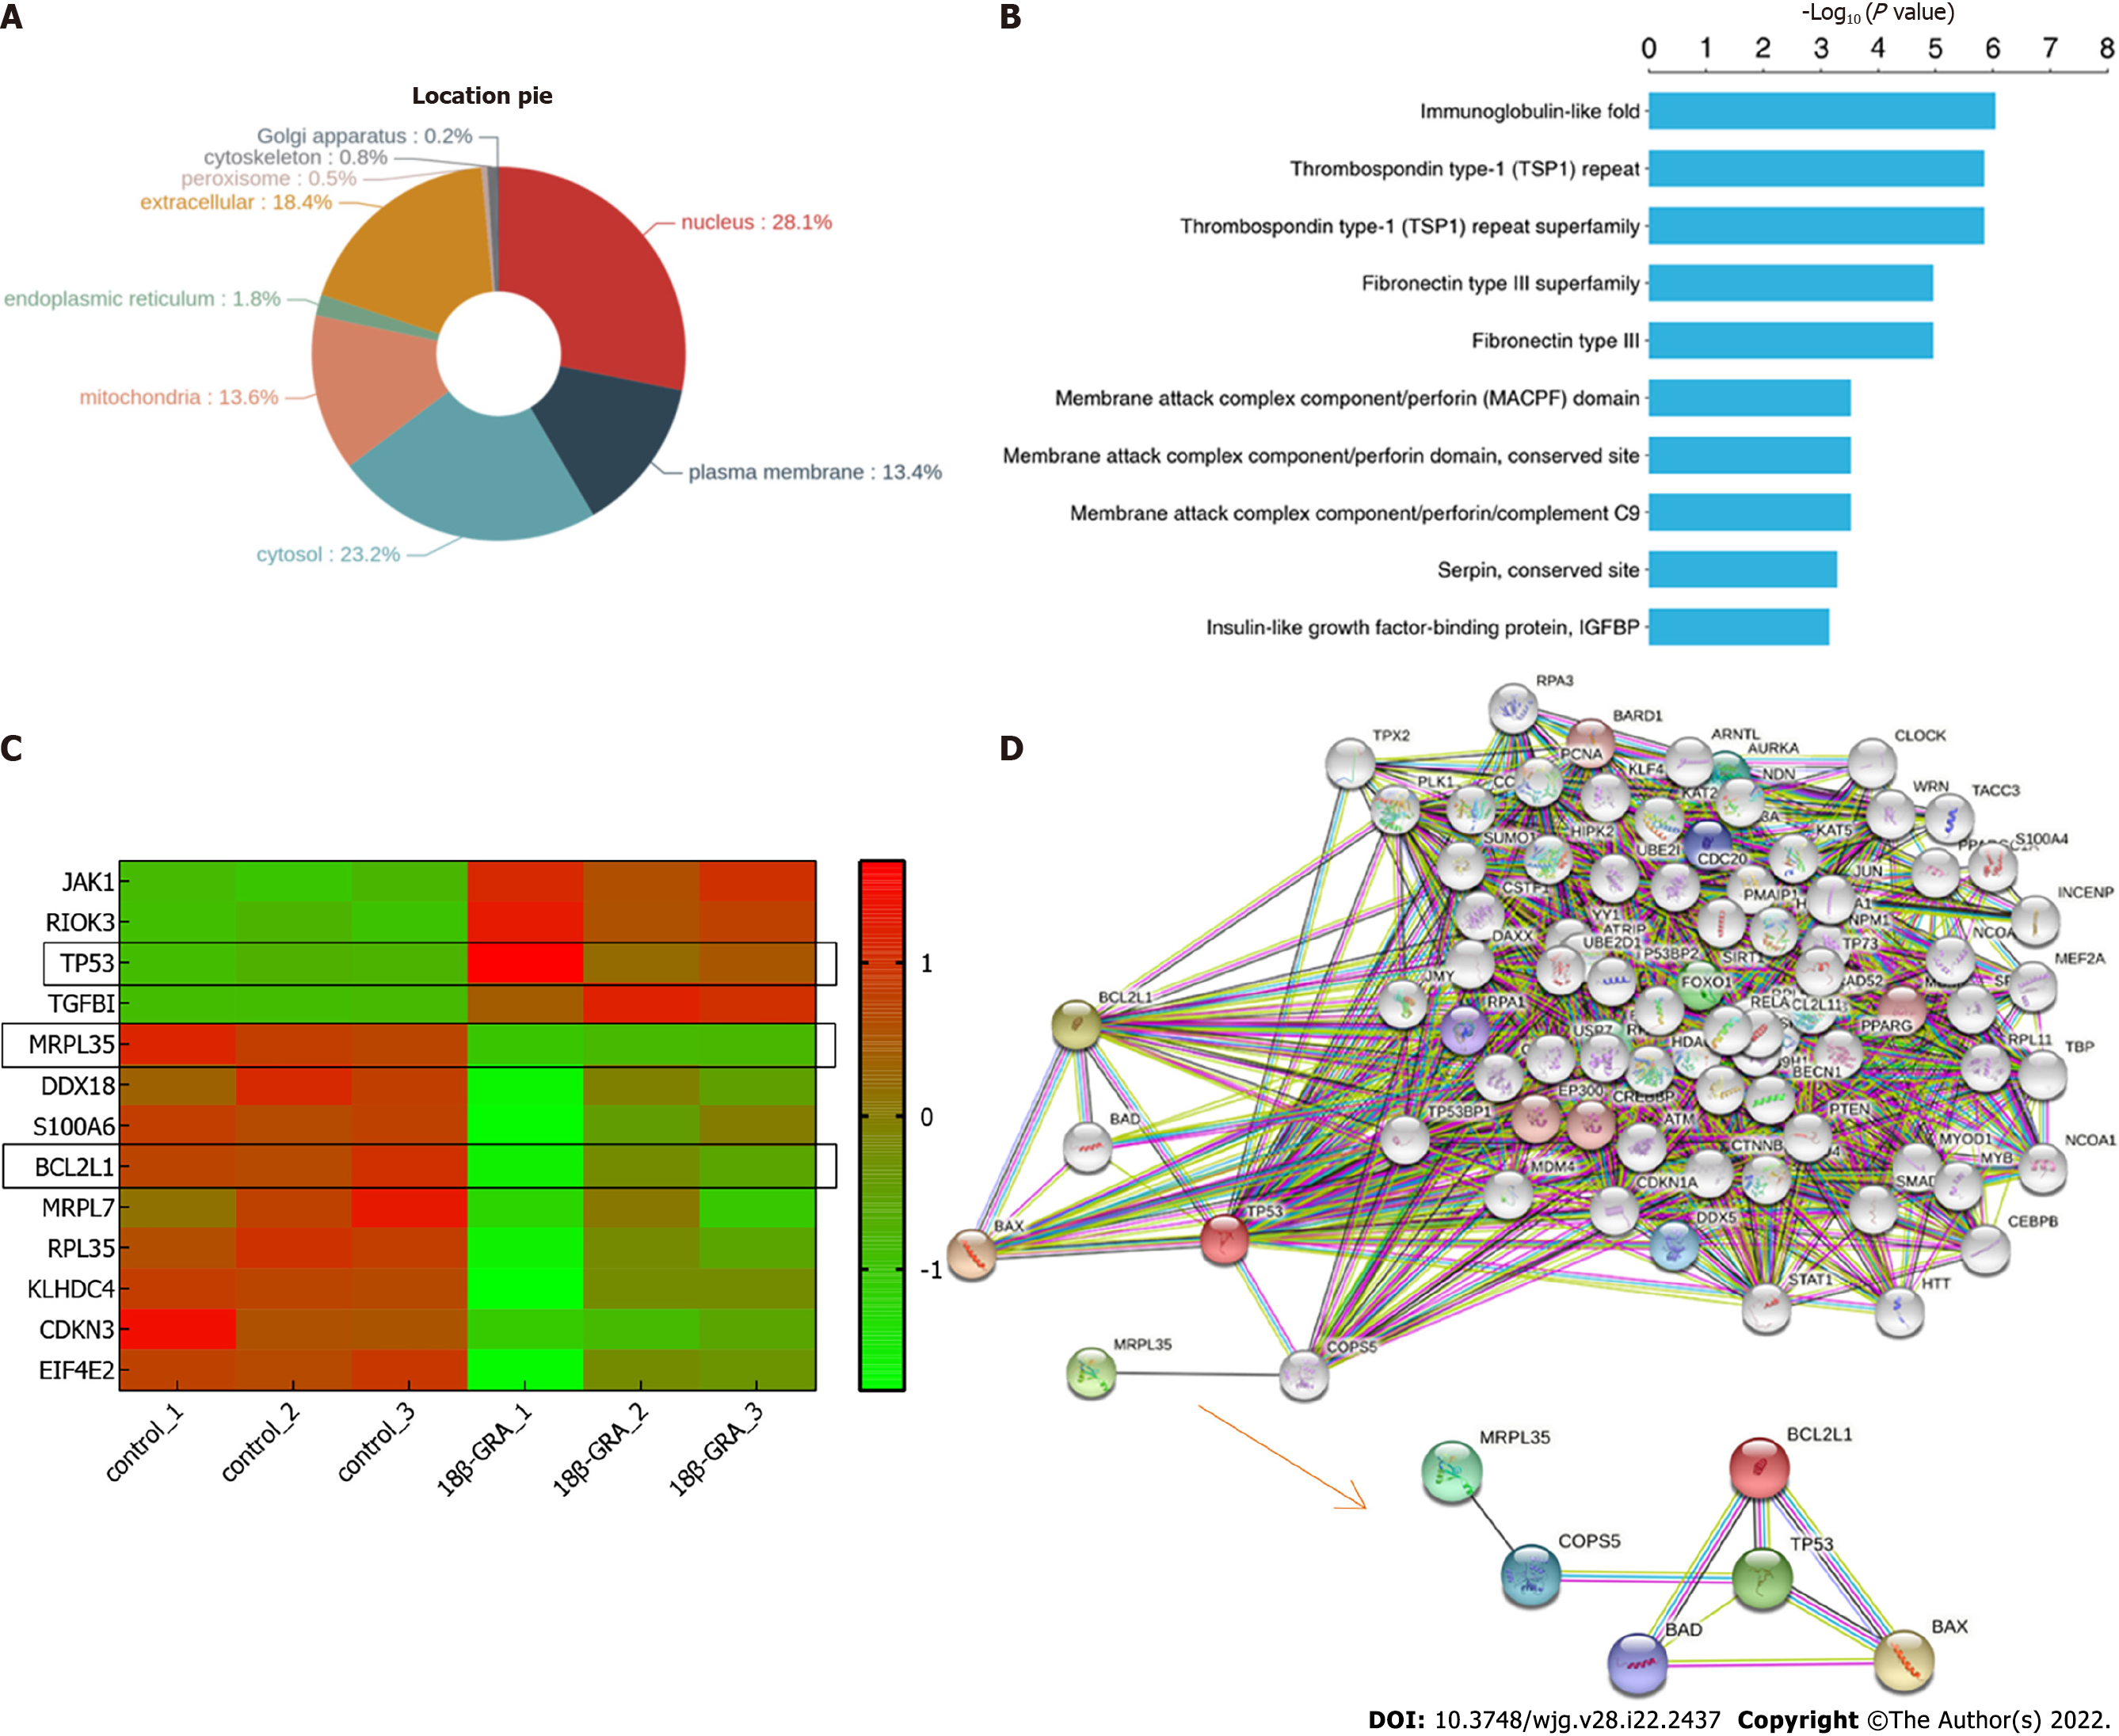
Figure 10 Differentially expressed proteins.
A: Subcellular localization chart of differentially expressed proteins (DEPs); B: Protein domain enrichment analysis. The Y axis denotes the categories of the protein domain. The X axis denotes the enrichment score [−log(P value)]; C: Heatmap of the MRPL35, TP53, BCL2L1, and so on. The X-coordinate stands for the DEPs, while Y-coordinate stands for different groups; D: Network analysis of MRPL35, TP53, and BCL2L1. The connection was illustrated using the web-based tool STRING.
- Citation: Yuan L, Yang Y, Li X, Zhou X, Du YH, Liu WJ, Zhang L, Yu L, Ma TT, Li JX, Chen Y, Nan Y. 18β-glycyrrhetinic acid regulates mitochondrial ribosomal protein L35-associated apoptosis signaling pathways to inhibit proliferation of gastric carcinoma cells. World J Gastroenterol 2022; 28(22): 2437-2456
- URL: https://www.wjgnet.com/1007-9327/full/v28/i22/2437.htm
- DOI: https://dx.doi.org/10.3748/wjg.v28.i22.2437


