Copyright
©The Author(s) 2022.
World J Gastroenterol. Jun 7, 2022; 28(21): 2320-2333
Published online Jun 7, 2022. doi: 10.3748/wjg.v28.i21.2320
Published online Jun 7, 2022. doi: 10.3748/wjg.v28.i21.2320
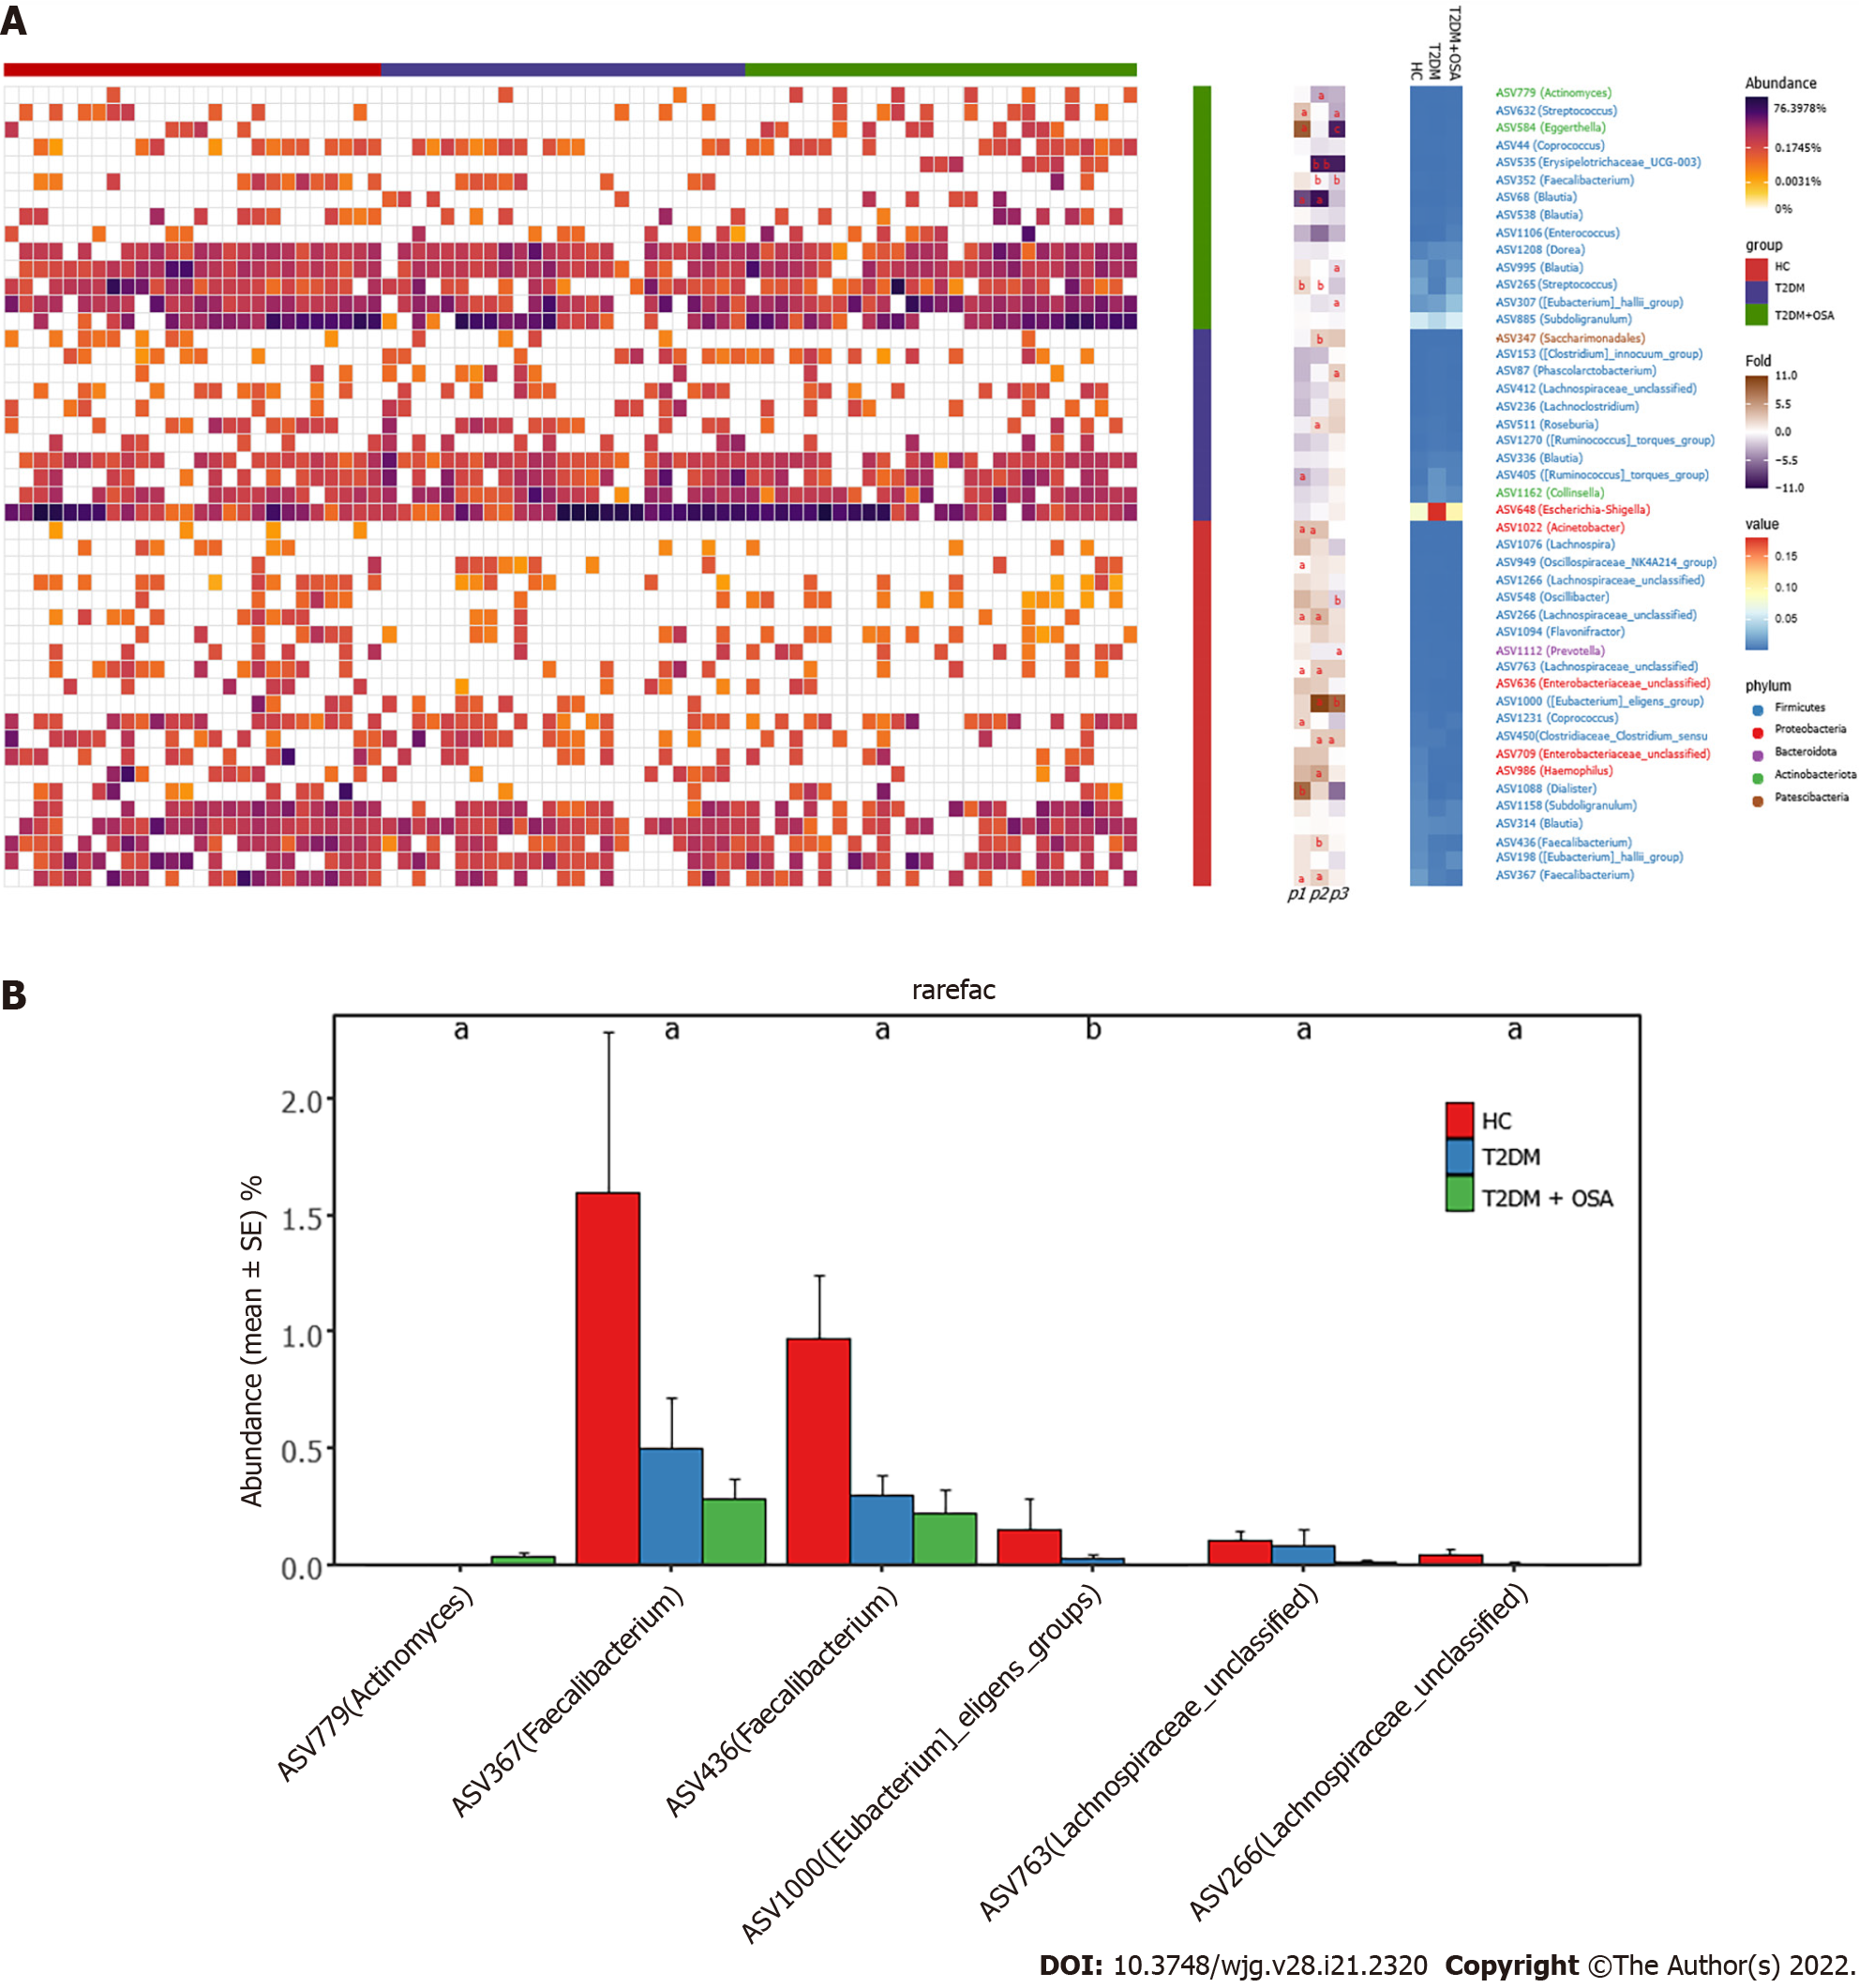
Figure 5 Amplicon sequence variants contributing to the changes in the gut microbiota in groups healthy control, type 2 diabetes mellitus, and type 2 diabetes mellitus plus obstructive sleep apnea.
A: The heatmap shows the relative abundance of the 46 amplicon sequence variants (ASVs) significantly different in the three groups. The fold ratio (log2-transformed) indicated the relative abundance of the 46 ASVs between the two different groups [P1: Type 2 diabetes mellitus (T2DM) + obstructive sleep apnea (OSA) vs T2DM; P2: T2DM + OSA vs healthy control (HC); P3: HC vs T2DM]. aP < 0.05, bP < 0.01, cP < 0.001. Significant difference shown by the Mann–Whitney U test; B: With the increase in disease components, six key ASVs showed increasing or decreasing trends. aP < 0.05, bP < 0.01.
- Citation: Tang SS, Liang CH, Liu YL, Wei W, Deng XR, Shi XY, Wang LM, Zhang LJ, Yuan HJ. Intermittent hypoxia is involved in gut microbial dysbiosis in type 2 diabetes mellitus and obstructive sleep apnea-hypopnea syndrome. World J Gastroenterol 2022; 28(21): 2320-2333
- URL: https://www.wjgnet.com/1007-9327/full/v28/i21/2320.htm
- DOI: https://dx.doi.org/10.3748/wjg.v28.i21.2320


