Copyright
©The Author(s) 2022.
World J Gastroenterol. Jun 7, 2022; 28(21): 2320-2333
Published online Jun 7, 2022. doi: 10.3748/wjg.v28.i21.2320
Published online Jun 7, 2022. doi: 10.3748/wjg.v28.i21.2320
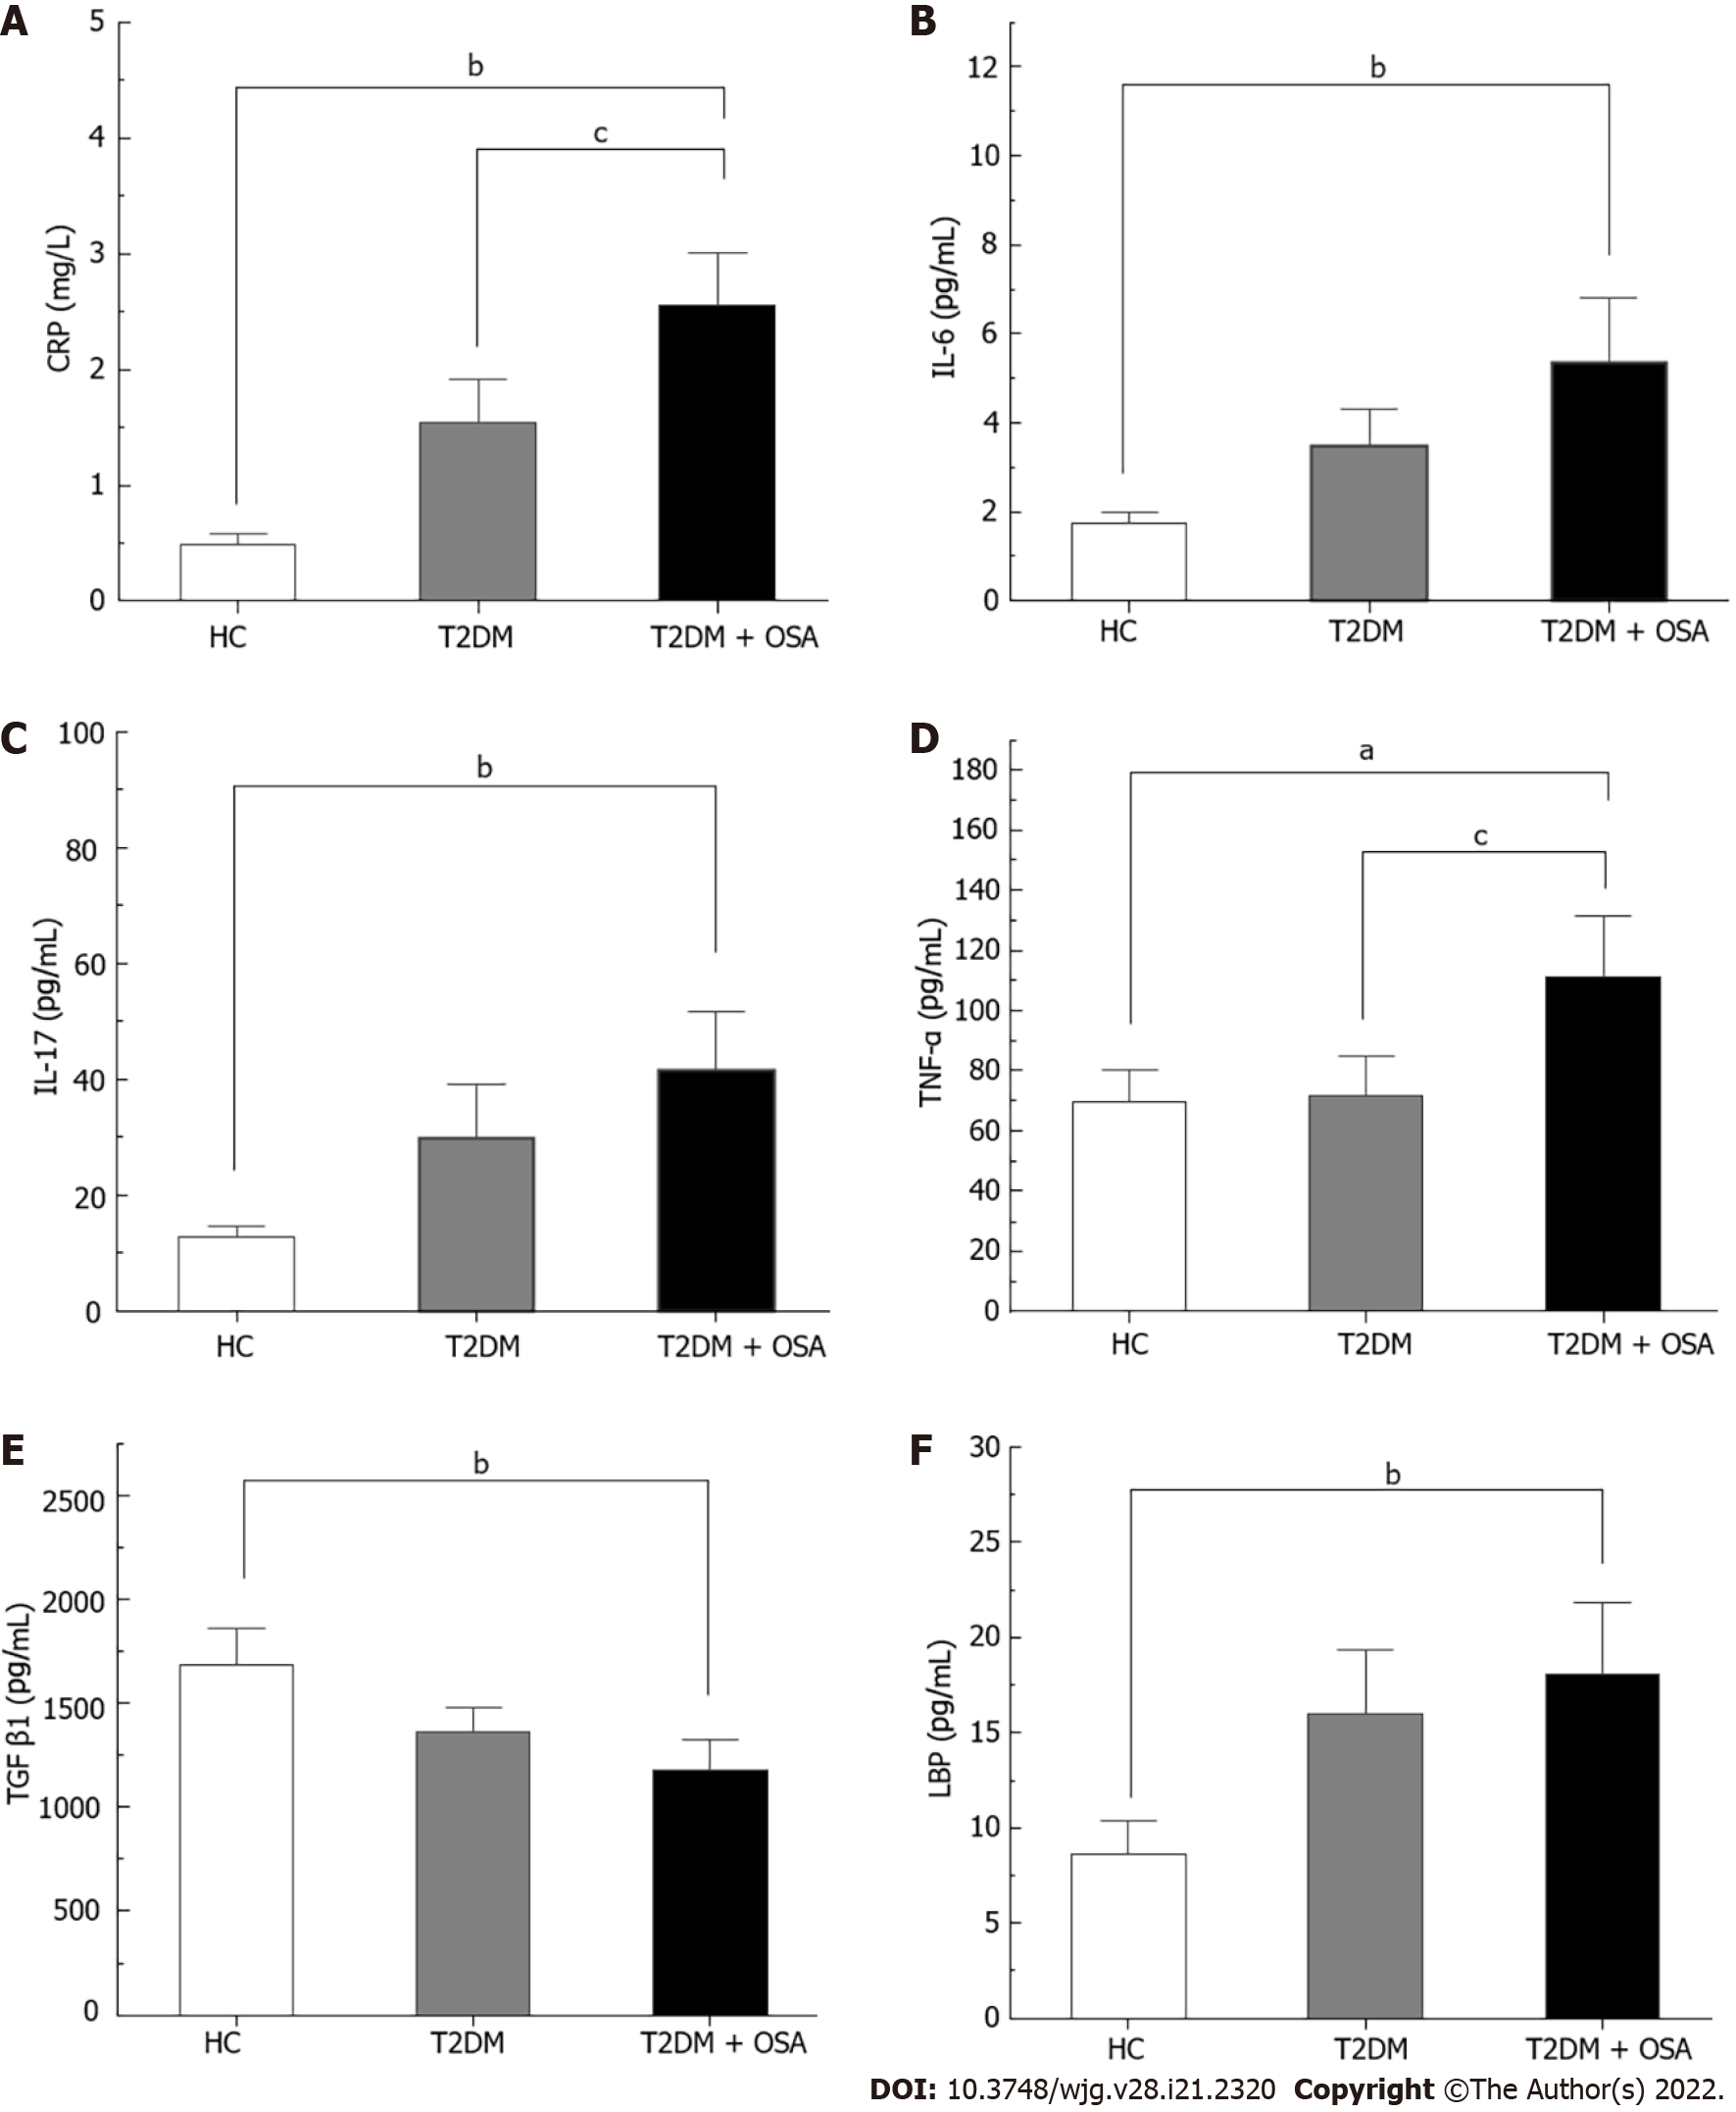
Figure 2 The concentrations of inflammatory factors in groups healthy control, type 2 diabetes mellitus, and type 2 diabetes mellitus plus obstructive sleep apnea.
A: CRP; B: IL-6; C: IL-17; D: TNF-α; E: TGF-β1; F: LBP. Bar charts show the means ± SE of the mean. aP < 0.05 vs healthy control (HC); bP < 0.01 vs HC; cP < 0.05 vs type 2 diabetes mellitus. The P value was based on Kruskal–Wallis test or one-way ANOVA. A significant difference was shown by the least significant difference t-test or Mann–Whitney U test. Significant differences were adjusted by Bonferroni correction. CRP: C-reaction protein; IL-6: Interleukin-6; IL-17: Interleukin-17; TNF-α: Tumor necrosis factor-α; TGF-β1: Transforming growth factor beta 1; LBP: Lipopolysaccharide-binding protein; HC: Healthy control; T2DM: Type 2 diabetes mellitus; OSA: Obstructive sleep apnea.
- Citation: Tang SS, Liang CH, Liu YL, Wei W, Deng XR, Shi XY, Wang LM, Zhang LJ, Yuan HJ. Intermittent hypoxia is involved in gut microbial dysbiosis in type 2 diabetes mellitus and obstructive sleep apnea-hypopnea syndrome. World J Gastroenterol 2022; 28(21): 2320-2333
- URL: https://www.wjgnet.com/1007-9327/full/v28/i21/2320.htm
- DOI: https://dx.doi.org/10.3748/wjg.v28.i21.2320


