Copyright
©The Author(s) 2022.
World J Gastroenterol. May 21, 2022; 28(19): 2100-2111
Published online May 21, 2022. doi: 10.3748/wjg.v28.i19.2100
Published online May 21, 2022. doi: 10.3748/wjg.v28.i19.2100
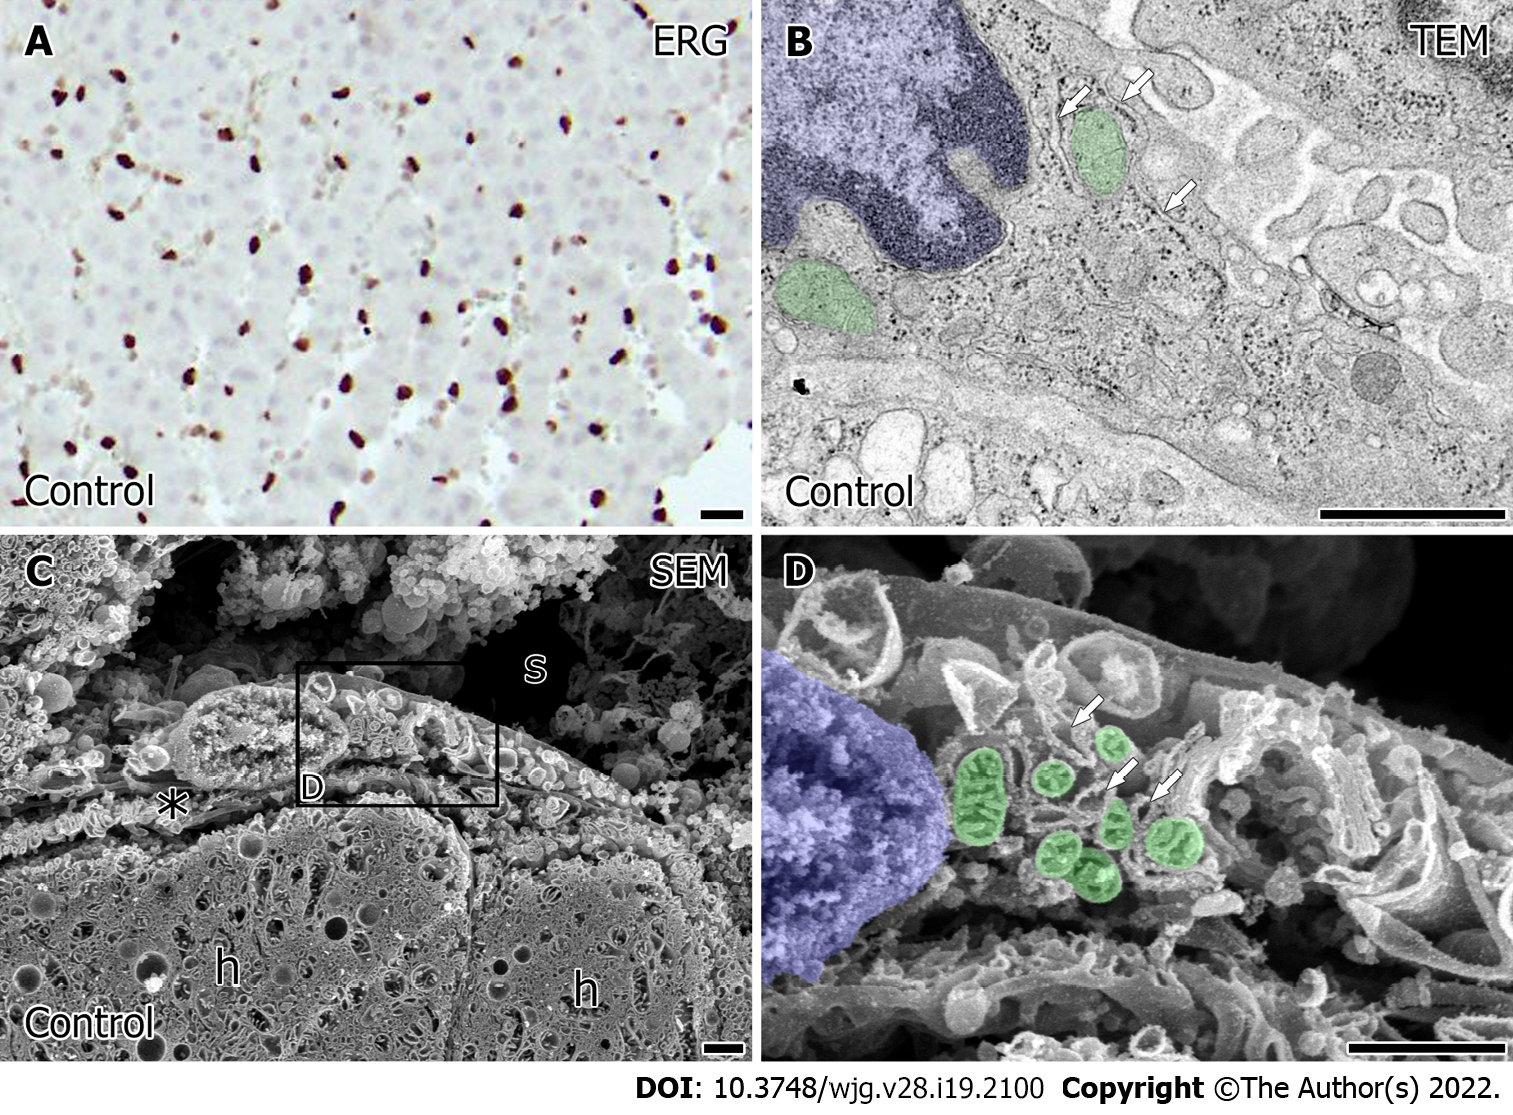
Figure 2 The distribution and ultrastructural characteristics in porcine liver sinusoidal endothelial cells of the control liver.
A: The representative image of the distribution of liver sinusoidal endothelial cells (LSEC) in the porcine liver indicated by the immunohistochemical staining with antibody to ERG. Bar = 10 μm; B: Typical LSEC were identified in the ultrathin sections (90 nm) of the Epon 812-embedded control liver tissue. Bars = 1 μm; C and D: LSEC was observed by scanning electron microscopy in osmium-macerated control porcine liver. s: sinusoid. h: Hepatocyte. The space of Disse was indicated by an asterisk. The partial area indicated in C was further observed in high magnification D. Bars = 1 μm. Mitochondria is represented in green and the nucleus is represented in blue. Arrows indicate the rough endoplasmic reticulum (rER). TEM: Transmission electron microscopy; SEM: Scanning electron microscopy.
- Citation: Bochimoto H, Ishihara Y, Mohd Zin NK, Iwata H, Kondoh D, Obara H, Matsuno N. Ultrastructural changes in porcine liver sinusoidal endothelial cells of machine perfused liver donated after cardiac death. World J Gastroenterol 2022; 28(19): 2100-2111
- URL: https://www.wjgnet.com/1007-9327/full/v28/i19/2100.htm
- DOI: https://dx.doi.org/10.3748/wjg.v28.i19.2100


