Copyright
©The Author(s) 2022.
World J Gastroenterol. May 14, 2022; 28(18): 1981-1995
Published online May 14, 2022. doi: 10.3748/wjg.v28.i18.1981
Published online May 14, 2022. doi: 10.3748/wjg.v28.i18.1981
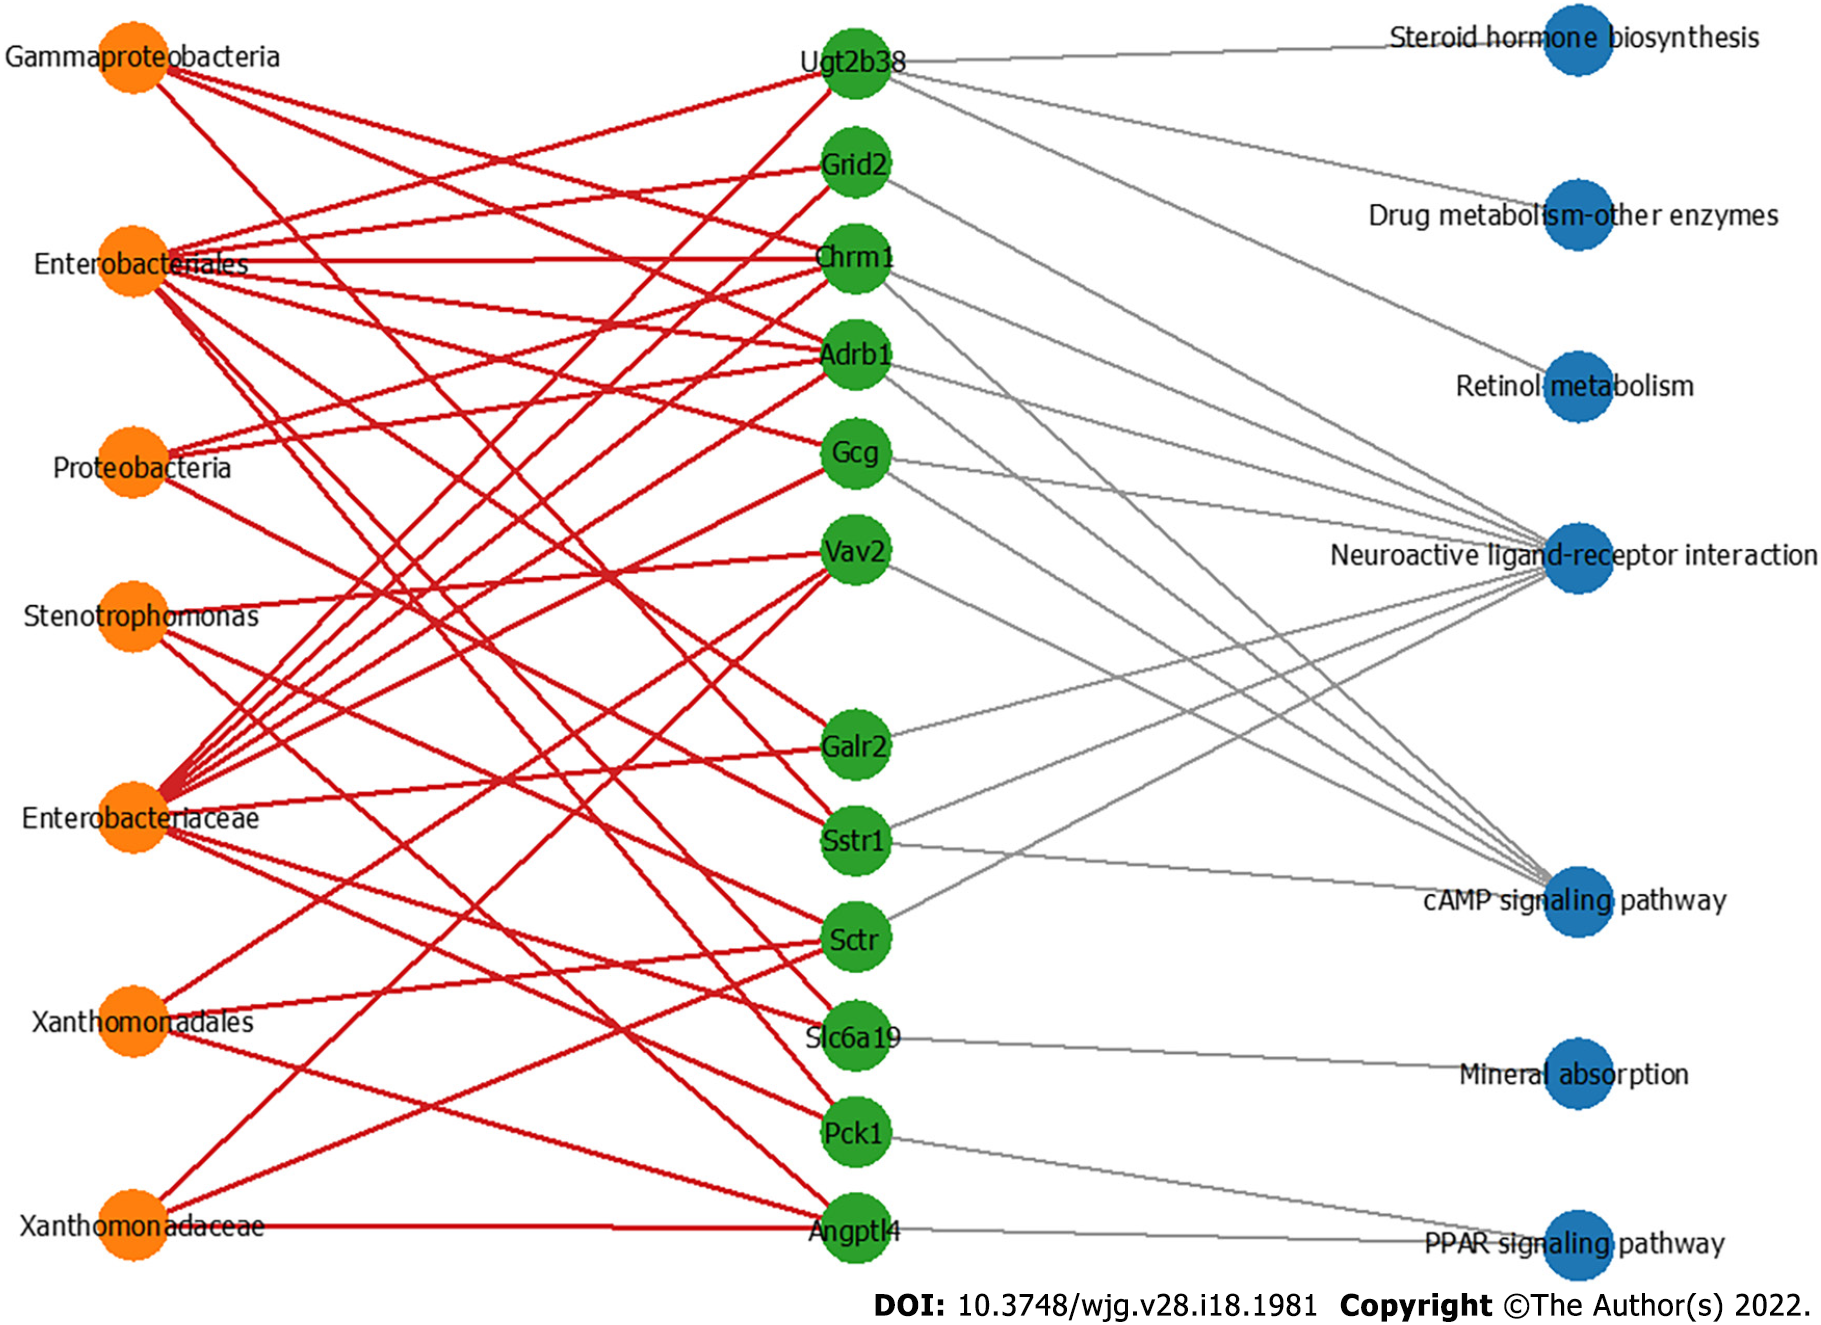
Figure 6 The co-occurrence network shows the correlations of the colon mucosa microbiota with the differentially expressed genes.
Edges: Correlations with P values < 0.01; red edges: Positive correlations; gray edges: Relationship between the genes and the pathways; green nodes: Genes involved in the top seven significantly differential KEGG pathways in the azoxymethane/dextran sulfate sodium salt (AOM/DSS)-FUSO group compared with the AOM/DSS group; orange nodes: The differential bacterial taxa identified by LEfSe analysis; blue nodes: Related pathways of defferentially expressed genes.
- Citation: Wu N, Feng YQ, Lyu N, Wang D, Yu WD, Hu YF. Fusobacterium nucleatum promotes colon cancer progression by changing the mucosal microbiota and colon transcriptome in a mouse model. World J Gastroenterol 2022; 28(18): 1981-1995
- URL: https://www.wjgnet.com/1007-9327/full/v28/i18/1981.htm
- DOI: https://dx.doi.org/10.3748/wjg.v28.i18.1981


