Copyright
©The Author(s) 2022.
World J Gastroenterol. May 14, 2022; 28(18): 1981-1995
Published online May 14, 2022. doi: 10.3748/wjg.v28.i18.1981
Published online May 14, 2022. doi: 10.3748/wjg.v28.i18.1981
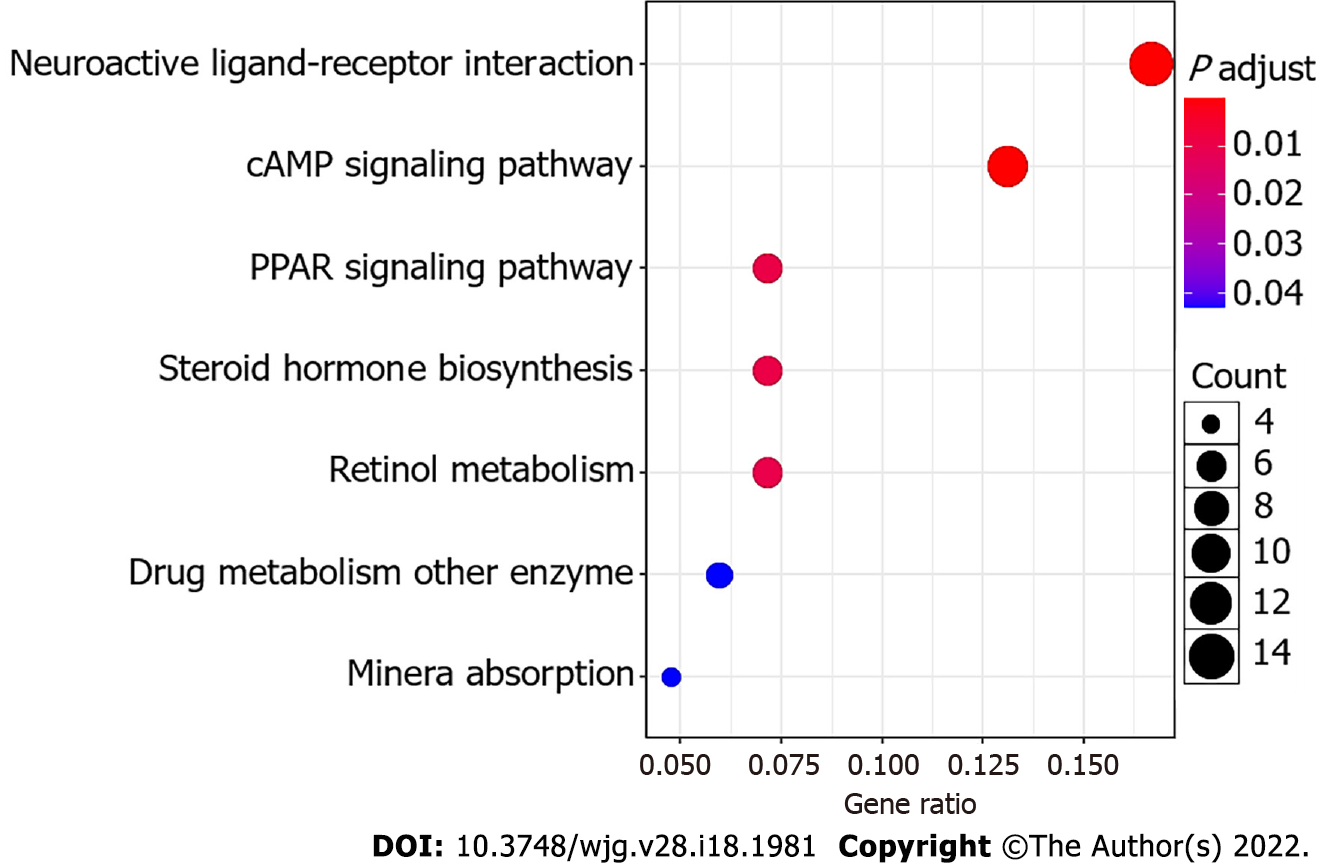
Figure 5 Bubble plot of the KEGG pathways.
The size of the bubble indicates the relative number of genes in the set. The color of the bubble indicates the adjusted P value.
- Citation: Wu N, Feng YQ, Lyu N, Wang D, Yu WD, Hu YF. Fusobacterium nucleatum promotes colon cancer progression by changing the mucosal microbiota and colon transcriptome in a mouse model. World J Gastroenterol 2022; 28(18): 1981-1995
- URL: https://www.wjgnet.com/1007-9327/full/v28/i18/1981.htm
- DOI: https://dx.doi.org/10.3748/wjg.v28.i18.1981


