Copyright
©The Author(s) 2022.
World J Gastroenterol. May 14, 2022; 28(18): 1981-1995
Published online May 14, 2022. doi: 10.3748/wjg.v28.i18.1981
Published online May 14, 2022. doi: 10.3748/wjg.v28.i18.1981
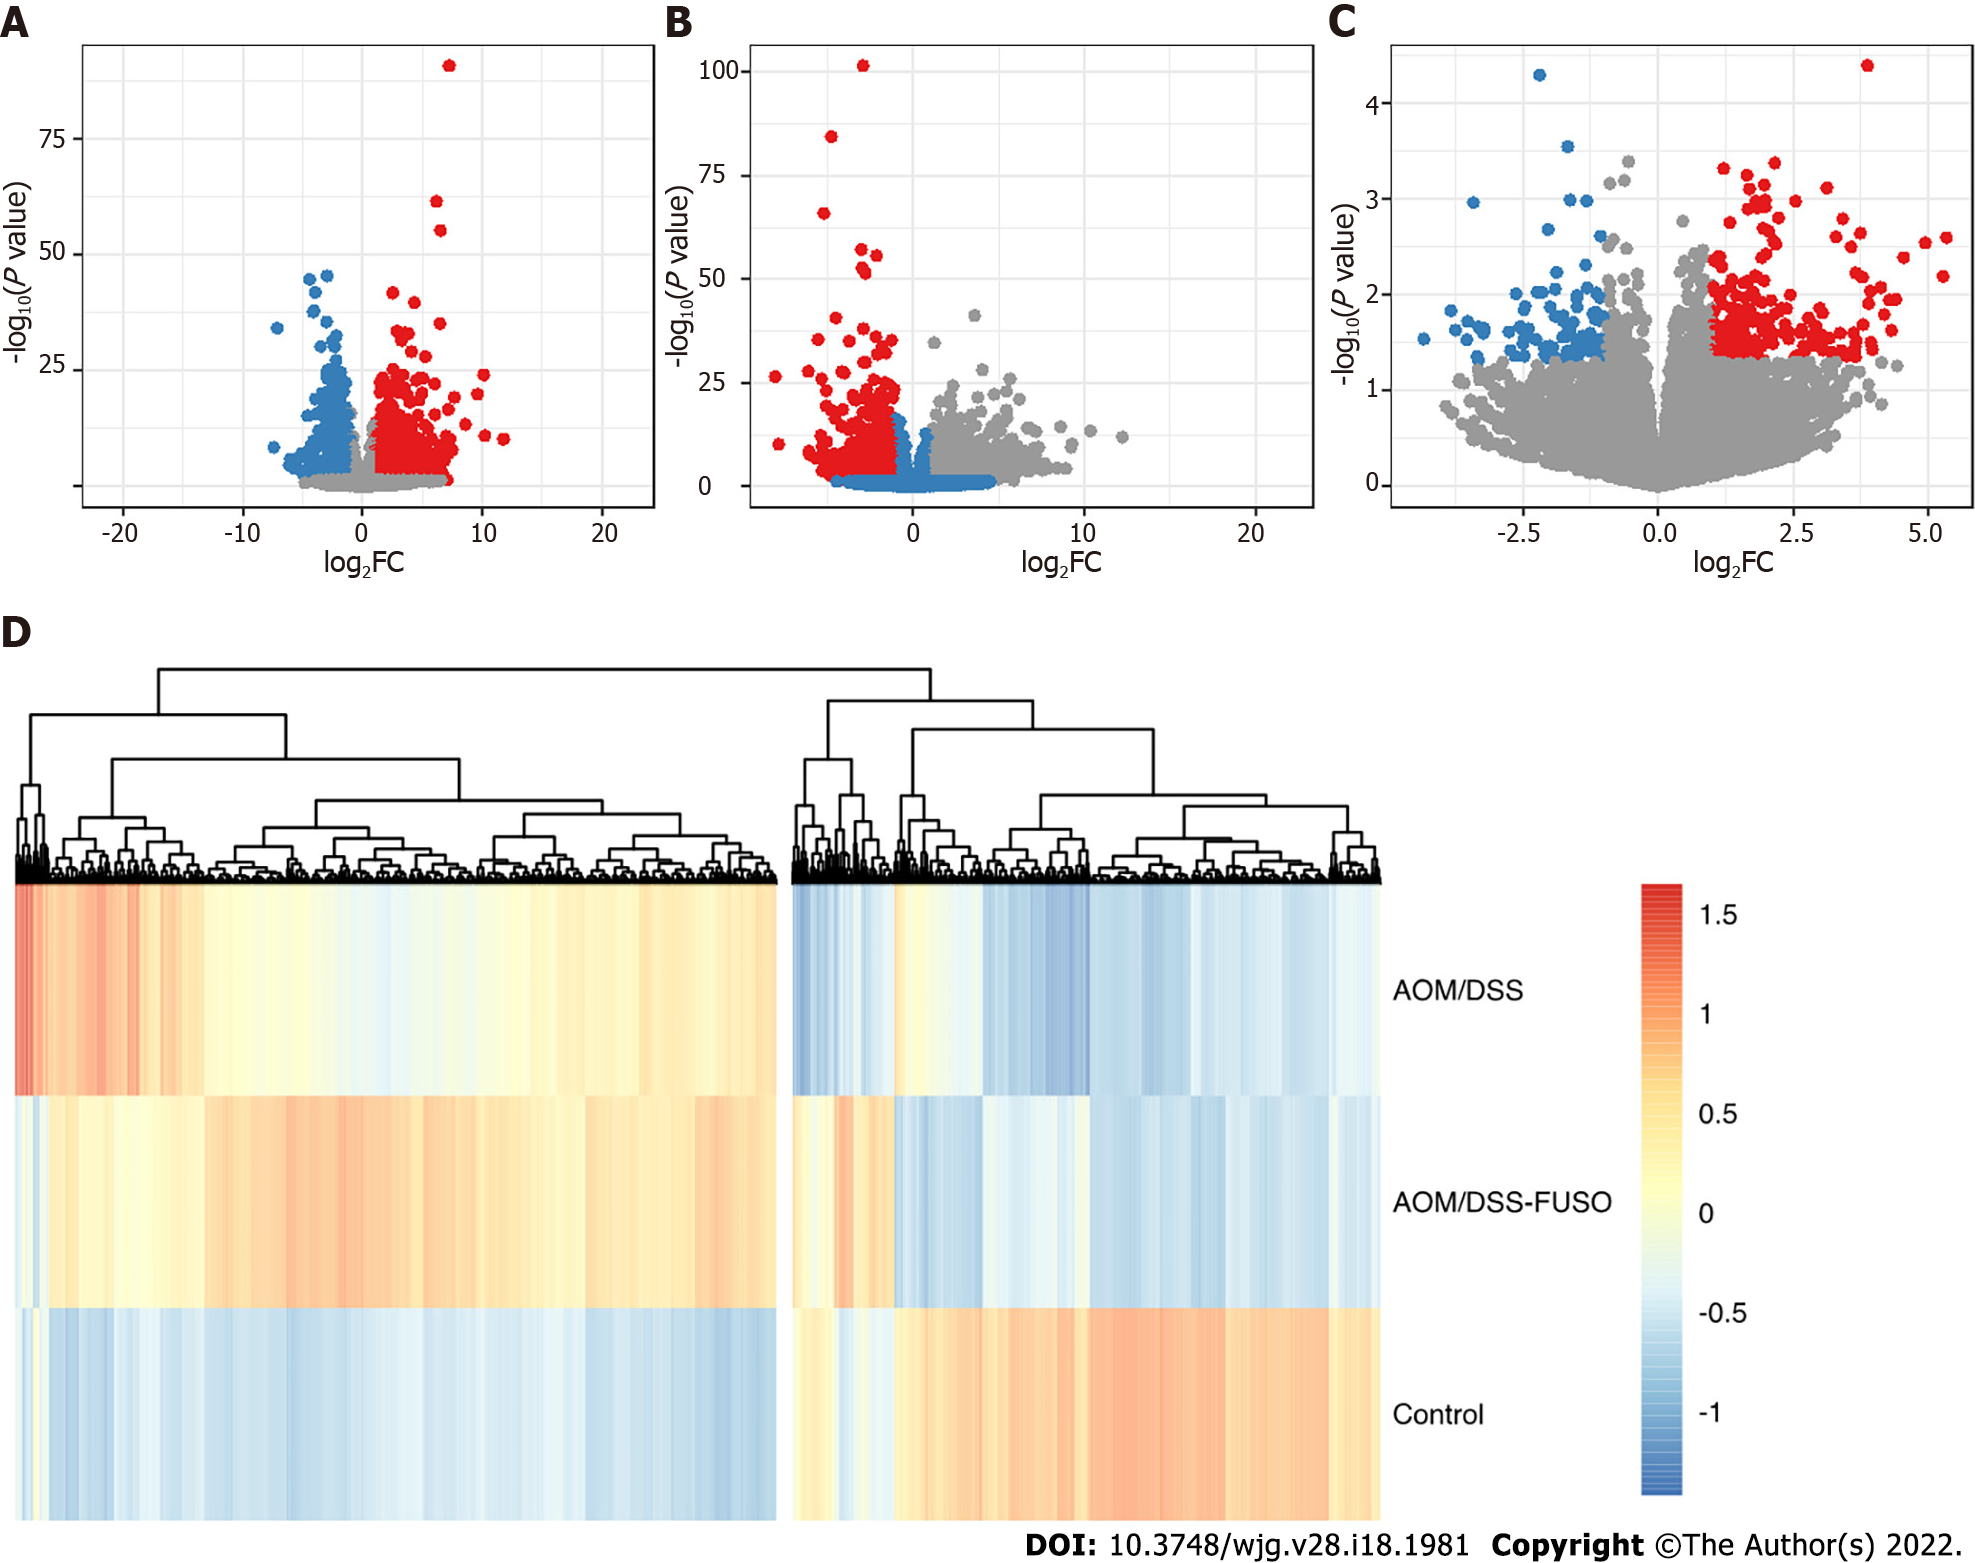
Figure 4 The differentially expressed genes of the mucosa.
A: Volcano plot showing the differentially expressed genes between the azoxymethane/dextran sulfate sodium salt (AOM/DSS) group and the control group; B: Volcano plot showing the differentially expressed genes between the AOM/DSS-FUSO group and the control group; C: Volcano plot showing the differentially expressed genes between the AOM/DSS-FUSO group and the AOM/DSS group. Significantly upregulated genes are shown in red (P < 0.05 and log2FC ≥ 1). Significantly downregulated genes are shown in blue (P < 0.05 and log2FC ≤ -1). The numbers of significantly upregulated genes were 1374 for (A), 1939 for (B) and 231 for (C). The numbers of significantly downregulated genes were 1050 for (A), 1104 for (B) and 92 for (C); D: Patterns of the abundance of all of the differentially expressed genes in the upper panels. The colors indicate the Z scores of the mean abundance in each group. AOM: Azoxymethane; DSS: Dextran sulfate sodium salt.
- Citation: Wu N, Feng YQ, Lyu N, Wang D, Yu WD, Hu YF. Fusobacterium nucleatum promotes colon cancer progression by changing the mucosal microbiota and colon transcriptome in a mouse model. World J Gastroenterol 2022; 28(18): 1981-1995
- URL: https://www.wjgnet.com/1007-9327/full/v28/i18/1981.htm
- DOI: https://dx.doi.org/10.3748/wjg.v28.i18.1981


