Copyright
©The Author(s) 2022.
World J Gastroenterol. May 7, 2022; 28(17): 1781-1797
Published online May 7, 2022. doi: 10.3748/wjg.v28.i17.1781
Published online May 7, 2022. doi: 10.3748/wjg.v28.i17.1781
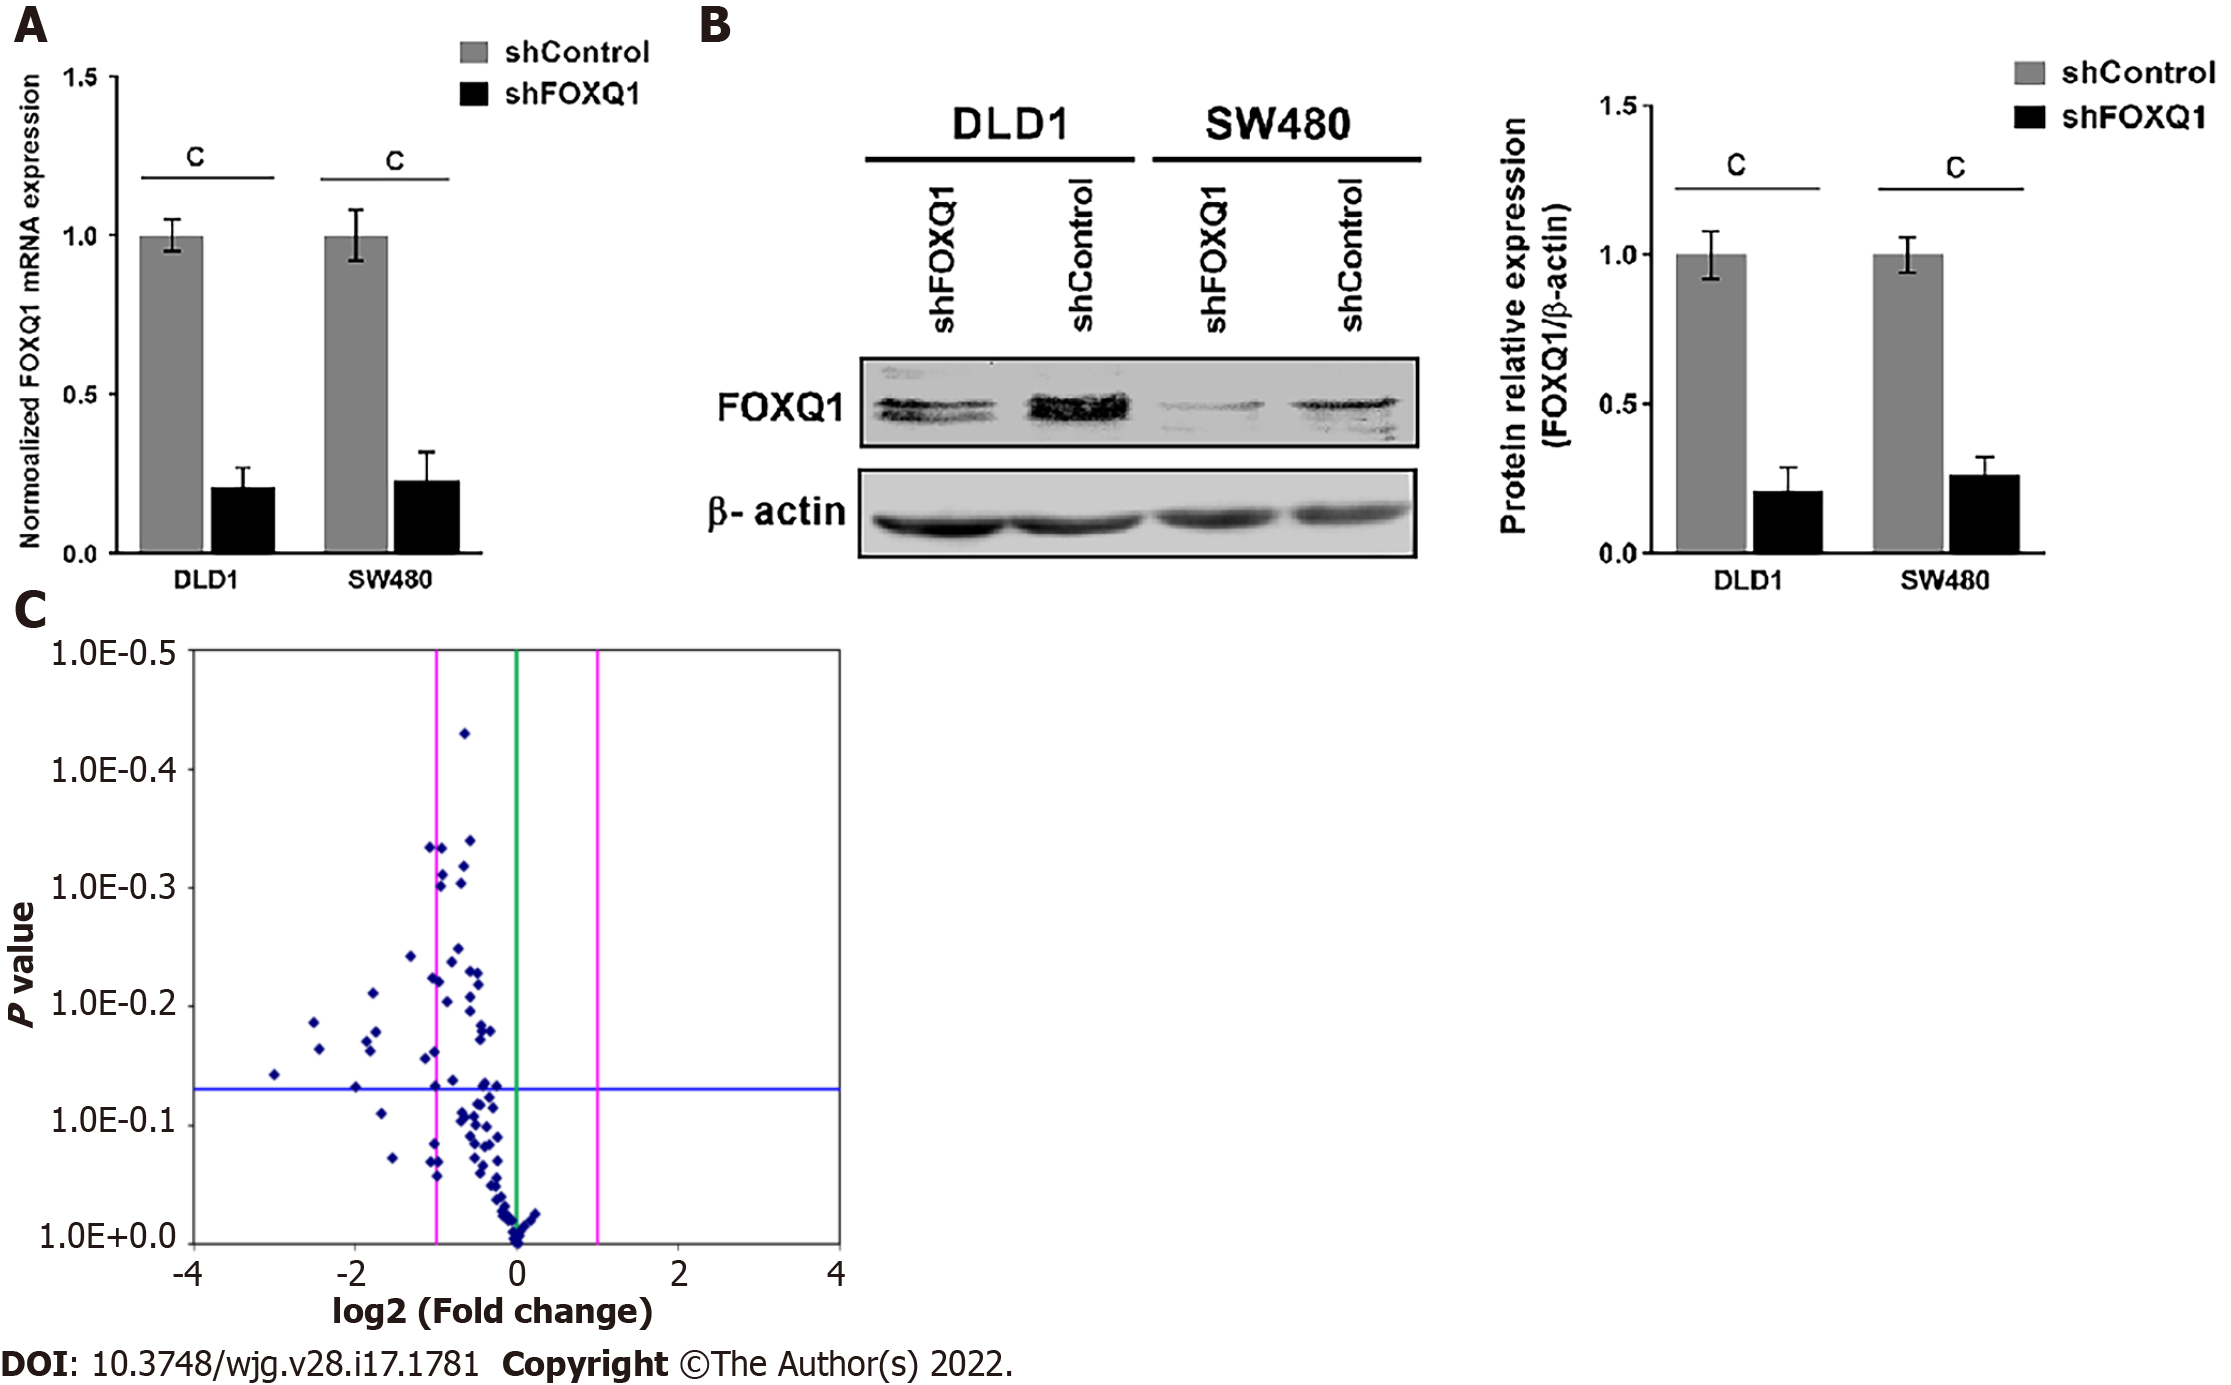
Figure 2 Forkhead Box q1 knockdown induces heparin binding epidermal growth factor suppression and epidermal growth factor/platelet-derived growth factor signaling pathway blockade in vitro according to transcriptional analysis of the generated forkhead Box q1 knockdown cell line.
A: Quantitative real-time polymerase chain reaction was performed to evaluate mRNA expression in the knockdown of forkhead Box q1 in DLD1 cells (DLD1-shFOXQ1) and SW480-shFOXQ1 cells (two-tailed, unpaired Student’s t test). Bars represent the mean ± SE of three independent experiments; B: Western blotting was performed to evaluate FOXQ1 protein expression in DLD1-shFOXQ1 and SW480-shFOXQ1 cells; C: Volcano plot illustrating differentially expressed genes using the epidermal growth factor (EGF)/platelet-derived growth factor (PDGF) array to compare DLD1-shFOXQ1 and DLD1-shControl cells. The vertical blue points in the plot represent 84 genes related to the EGF/PDGF signaling pathways. The vertical green line indicates a fold-change in gene expression of 1. The vertical pink lines indicate the threshold for fold-change (≥ 2.0 and ≤ -2.0). The horizontal blue line indicates the threshold for the P value of the t test. aP < 0.05; bP < 0.01; cP < 0.001. DLD1-shFOXQ1: The knockdown of forkhead Box q1 in DLD1 cells; SW480-shFOXQ1: The knockdown of forkhead Box q1 in SW480 cells.
- Citation: Zhang JJ, Cao CX, Wan LL, Zhang W, Liu ZJ, Wang JL, Guo Q, Tang H. Forkhead Box q1 promotes invasion and metastasis in colorectal cancer by activating the epidermal growth factor receptor pathway. World J Gastroenterol 2022; 28(17): 1781-1797
- URL: https://www.wjgnet.com/1007-9327/full/v28/i17/1781.htm
- DOI: https://dx.doi.org/10.3748/wjg.v28.i17.1781


