Copyright
©The Author(s) 2022.
World J Gastroenterol. Apr 14, 2022; 28(14): 1479-1493
Published online Apr 14, 2022. doi: 10.3748/wjg.v28.i14.1479
Published online Apr 14, 2022. doi: 10.3748/wjg.v28.i14.1479
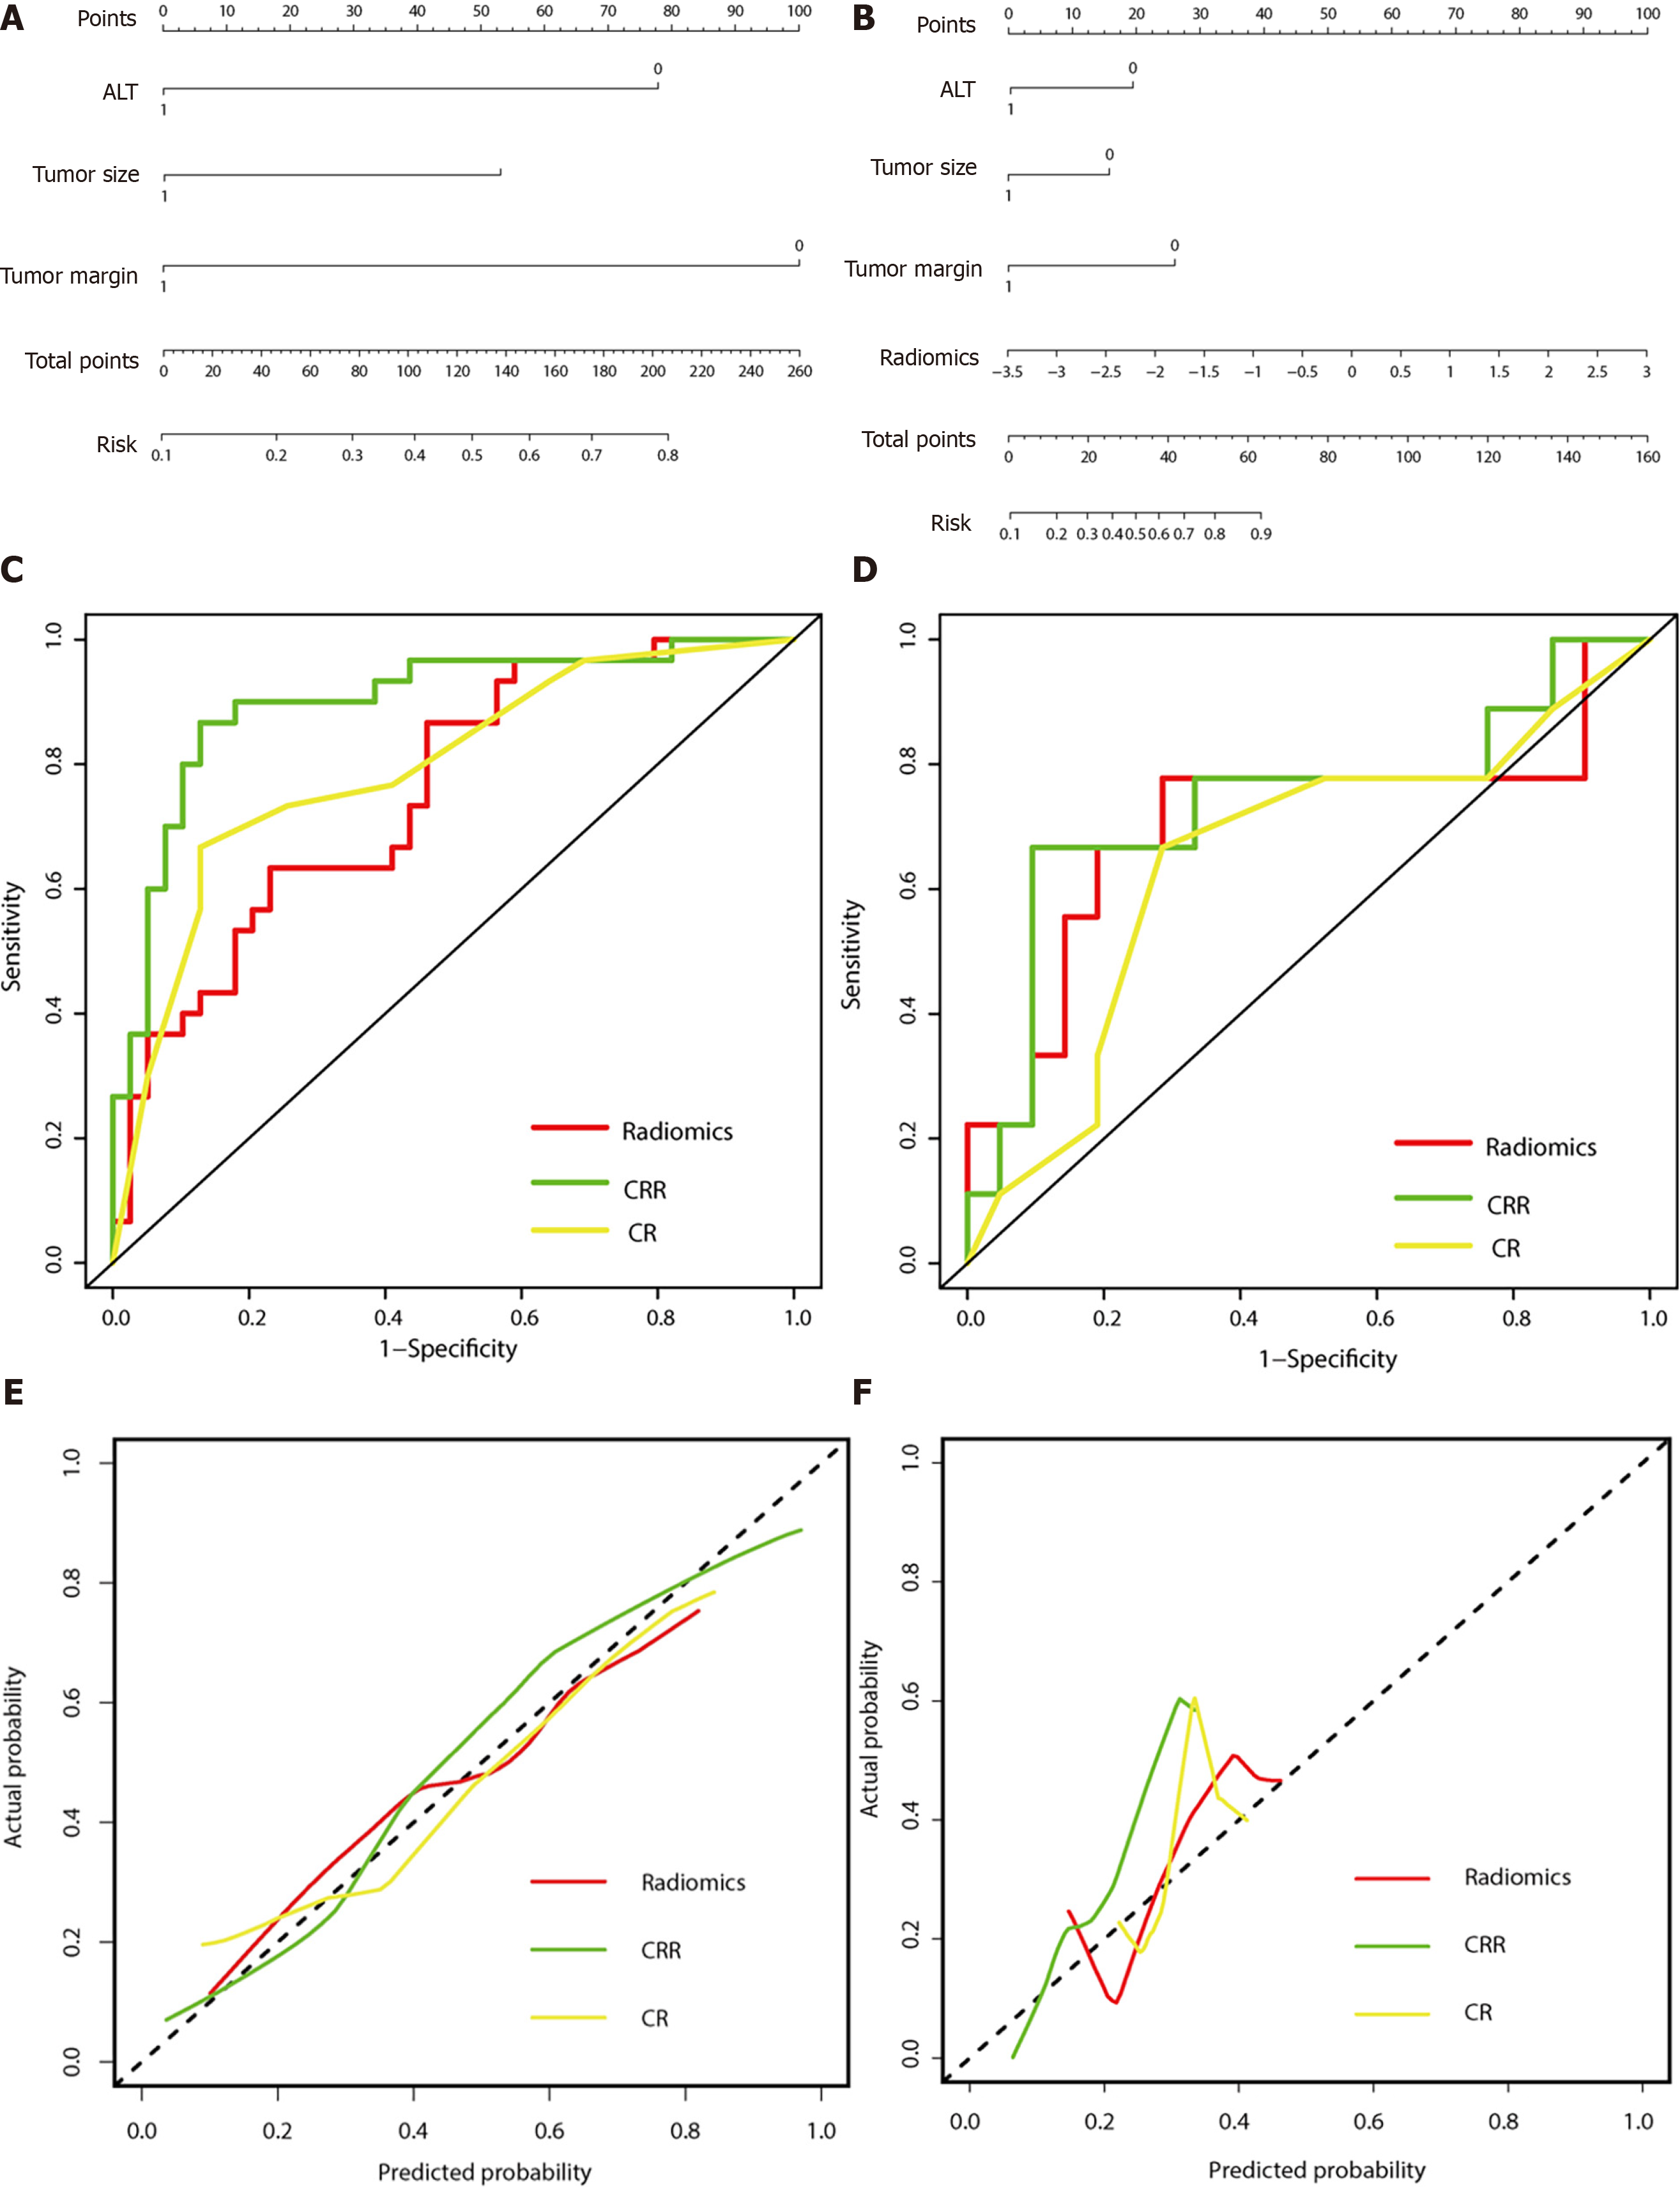
Figure 2 Performance of the three models.
A: The developed clinico-radiological (CR) nomogram; B: The developed clinico-radiological-radiomics (CRR) nomogram. Predictor points are found on the uppermost point scale that corresponds to each variable. On the bottom scale, the points for all variables are added and translated into a β-arrestin1 phosphorylation positivity probability. C: Comparison of receiver operating characteristic (ROC) curves of the radiomics model, CR model and CRR model in the training cohort; D: Comparison of receiver operating characteristic (ROC) curves of the radiomics model, CR model and CRR model in the validation cohort. E: Calibration curves of the three models in the training cohort; F: Calibration curves of the three models in the validation cohort. The actual high expression of p-β-arrestin1 is represented on the y-axis, and the predicted probability is represented on the x-axis. The closer fit of the solid line to the ideal black dotted line indicates a better calibration.
- Citation: Che F, Xu Q, Li Q, Huang ZX, Yang CW, Wang LY, Wei Y, Shi YJ, Song B. Radiomics signature: A potential biomarker for β-arrestin1 phosphorylation prediction in hepatocellular carcinoma. World J Gastroenterol 2022; 28(14): 1479-1493
- URL: https://www.wjgnet.com/1007-9327/full/v28/i14/1479.htm
- DOI: https://dx.doi.org/10.3748/wjg.v28.i14.1479


