Copyright
©The Author(s) 2022.
World J Gastroenterol. Apr 7, 2022; 28(13): 1315-1328
Published online Apr 7, 2022. doi: 10.3748/wjg.v28.i13.1315
Published online Apr 7, 2022. doi: 10.3748/wjg.v28.i13.1315
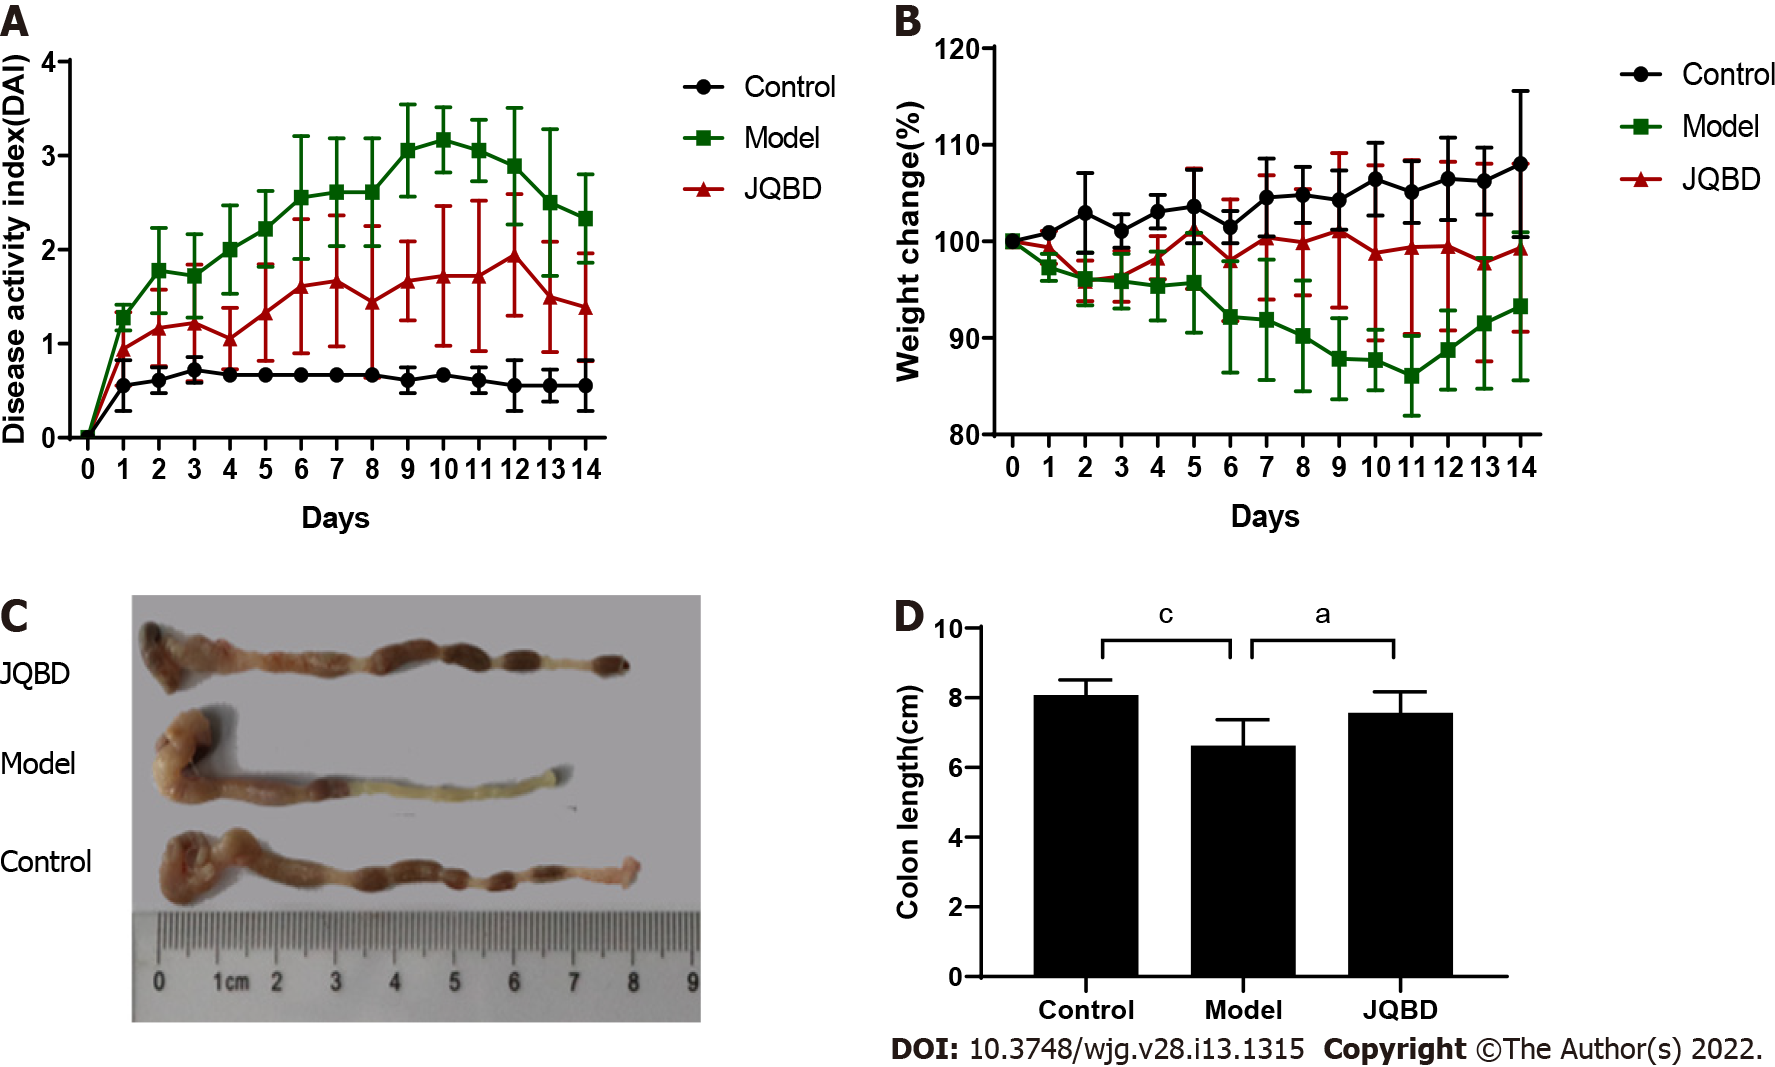
Figure 3 General condition of the mice.
A: Disease activity index scores gauged daily (n = 6 per group); B: Body weight measured daily (n = 6 per group); C and D: Colon length measurement and graph presenting the statistical analysis results. Data are presented as the mean ± SD. aP < 0.05; bP < 0.01; cP < 0.001 (n = 6 per group).
- Citation: Zhang YL, Chen Q, Zheng L, Zhang ZW, Chen YJ, Dai YC, Tang ZP. Jianpi Qingchang Bushen decoction improves inflammatory response and metabolic bone disorder in inflammatory bowel disease-induced bone loss. World J Gastroenterol 2022; 28(13): 1315-1328
- URL: https://www.wjgnet.com/1007-9327/full/v28/i13/1315.htm
- DOI: https://dx.doi.org/10.3748/wjg.v28.i13.1315


