Copyright
©The Author(s) 2021.
World J Gastroenterol. Feb 28, 2021; 27(8): 708-724
Published online Feb 28, 2021. doi: 10.3748/wjg.v27.i8.708
Published online Feb 28, 2021. doi: 10.3748/wjg.v27.i8.708
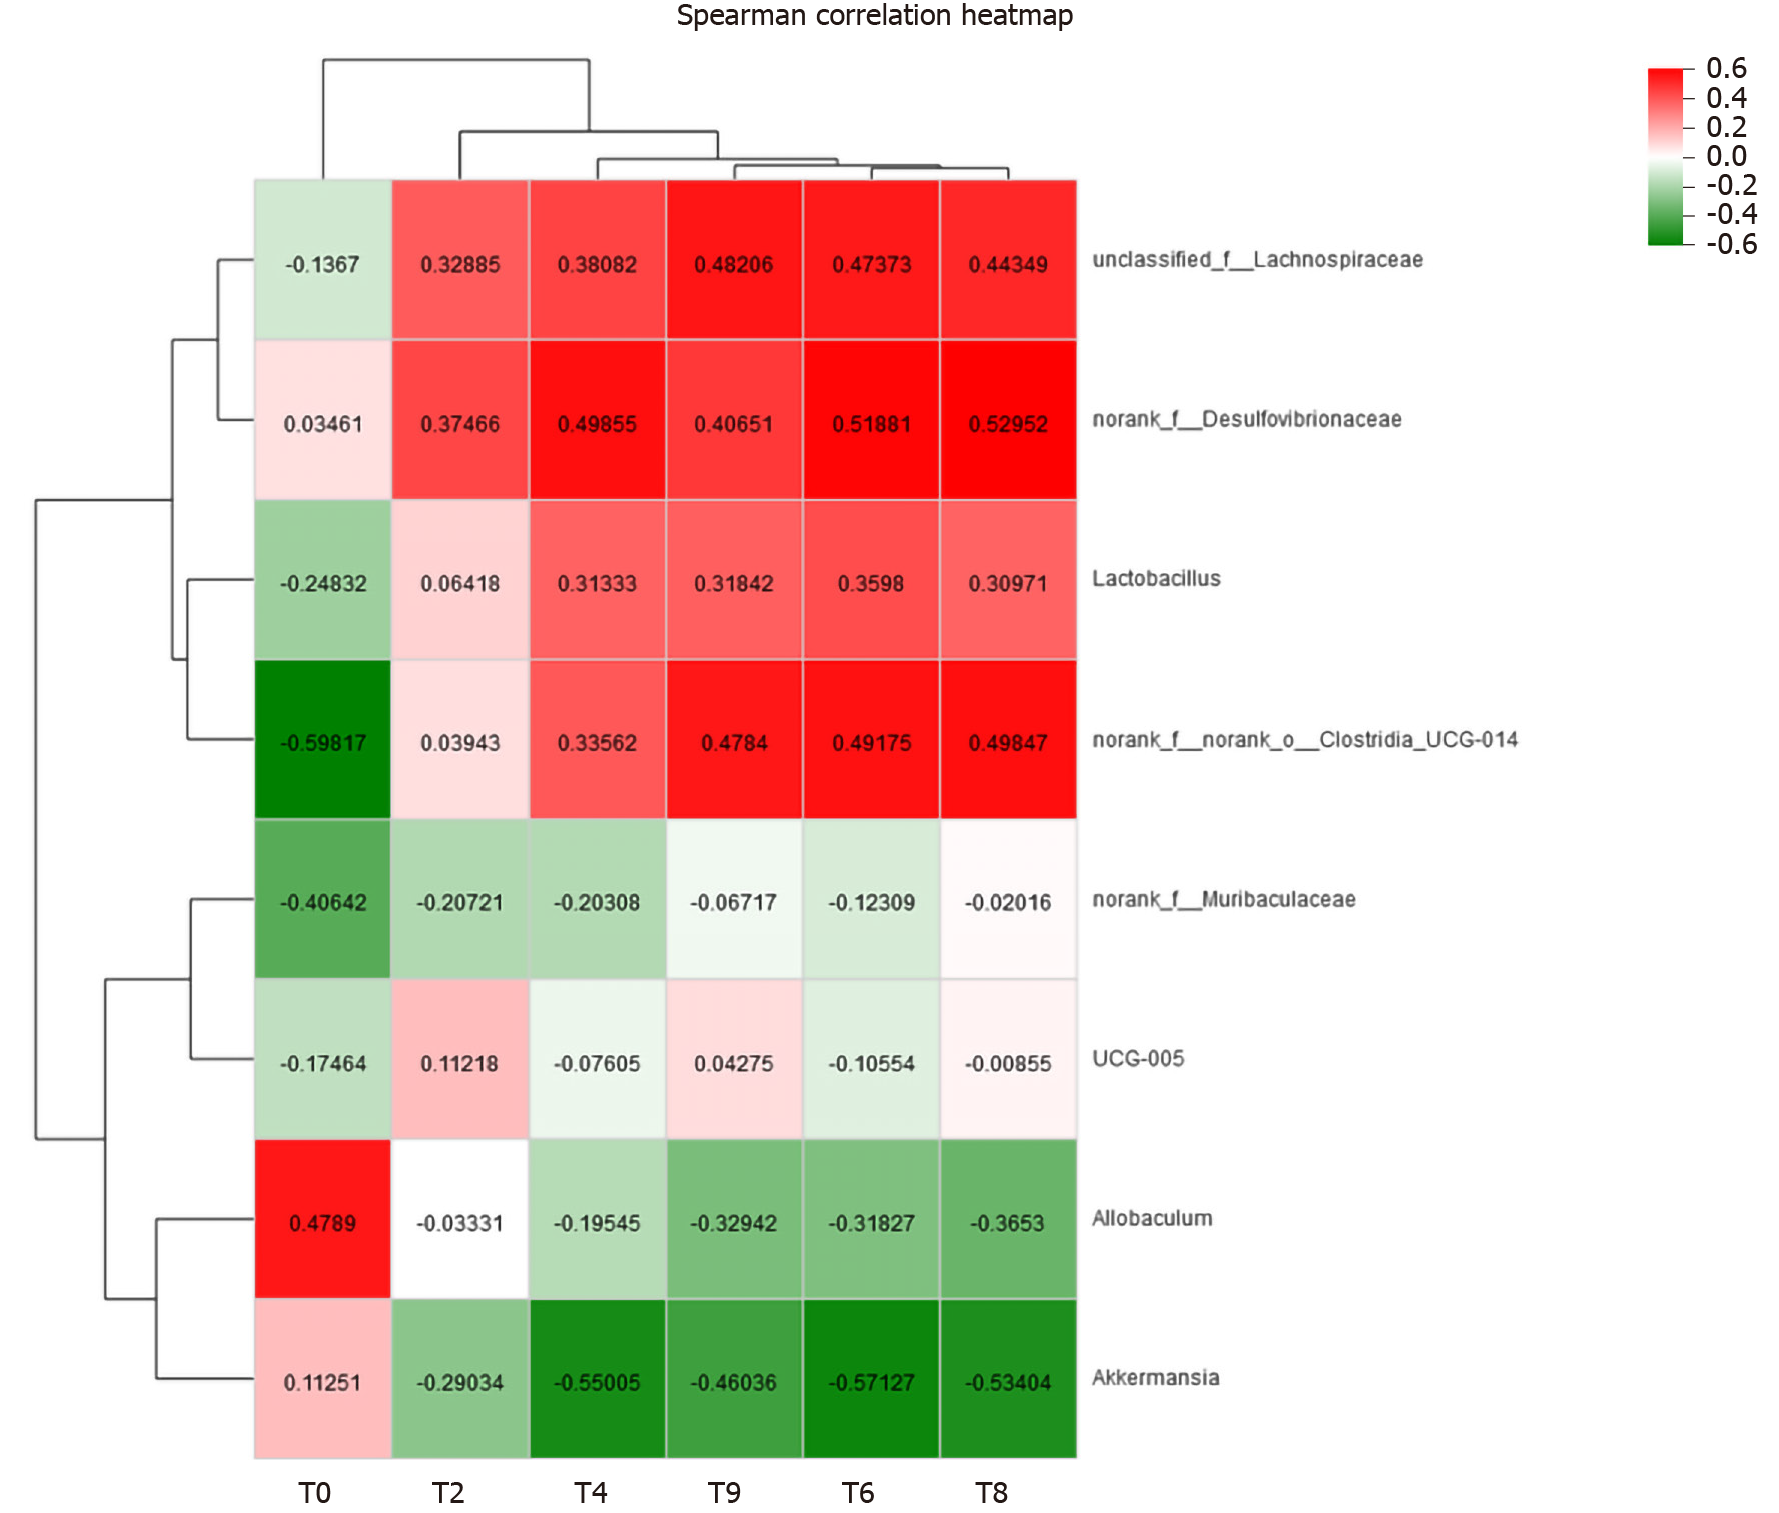
Figure 11 Correlation analysis between type 2 diabetes mellitus-related body weight and gut microbiota at the genus level.
The colours range from green (negative correlation) to red (positive correlation). Statistical significance was based on a P value of 0.05 (Spearman’s correlation coefficient). r values are indicated.
- Citation: Zhao JD, Li Y, Sun M, Yu CJ, Li JY, Wang SH, Yang D, Guo CL, Du X, Zhang WJ, Cheng RD, Diao XC, Fang ZH. Effect of berberine on hyperglycaemia and gut microbiota composition in type 2 diabetic Goto-Kakizaki rats. World J Gastroenterol 2021; 27(8): 708-724
- URL: https://www.wjgnet.com/1007-9327/full/v27/i8/708.htm
- DOI: https://dx.doi.org/10.3748/wjg.v27.i8.708


