Copyright
©The Author(s) 2021.
World J Gastroenterol. Dec 7, 2021; 27(45): 7801-7812
Published online Dec 7, 2021. doi: 10.3748/wjg.v27.i45.7801
Published online Dec 7, 2021. doi: 10.3748/wjg.v27.i45.7801
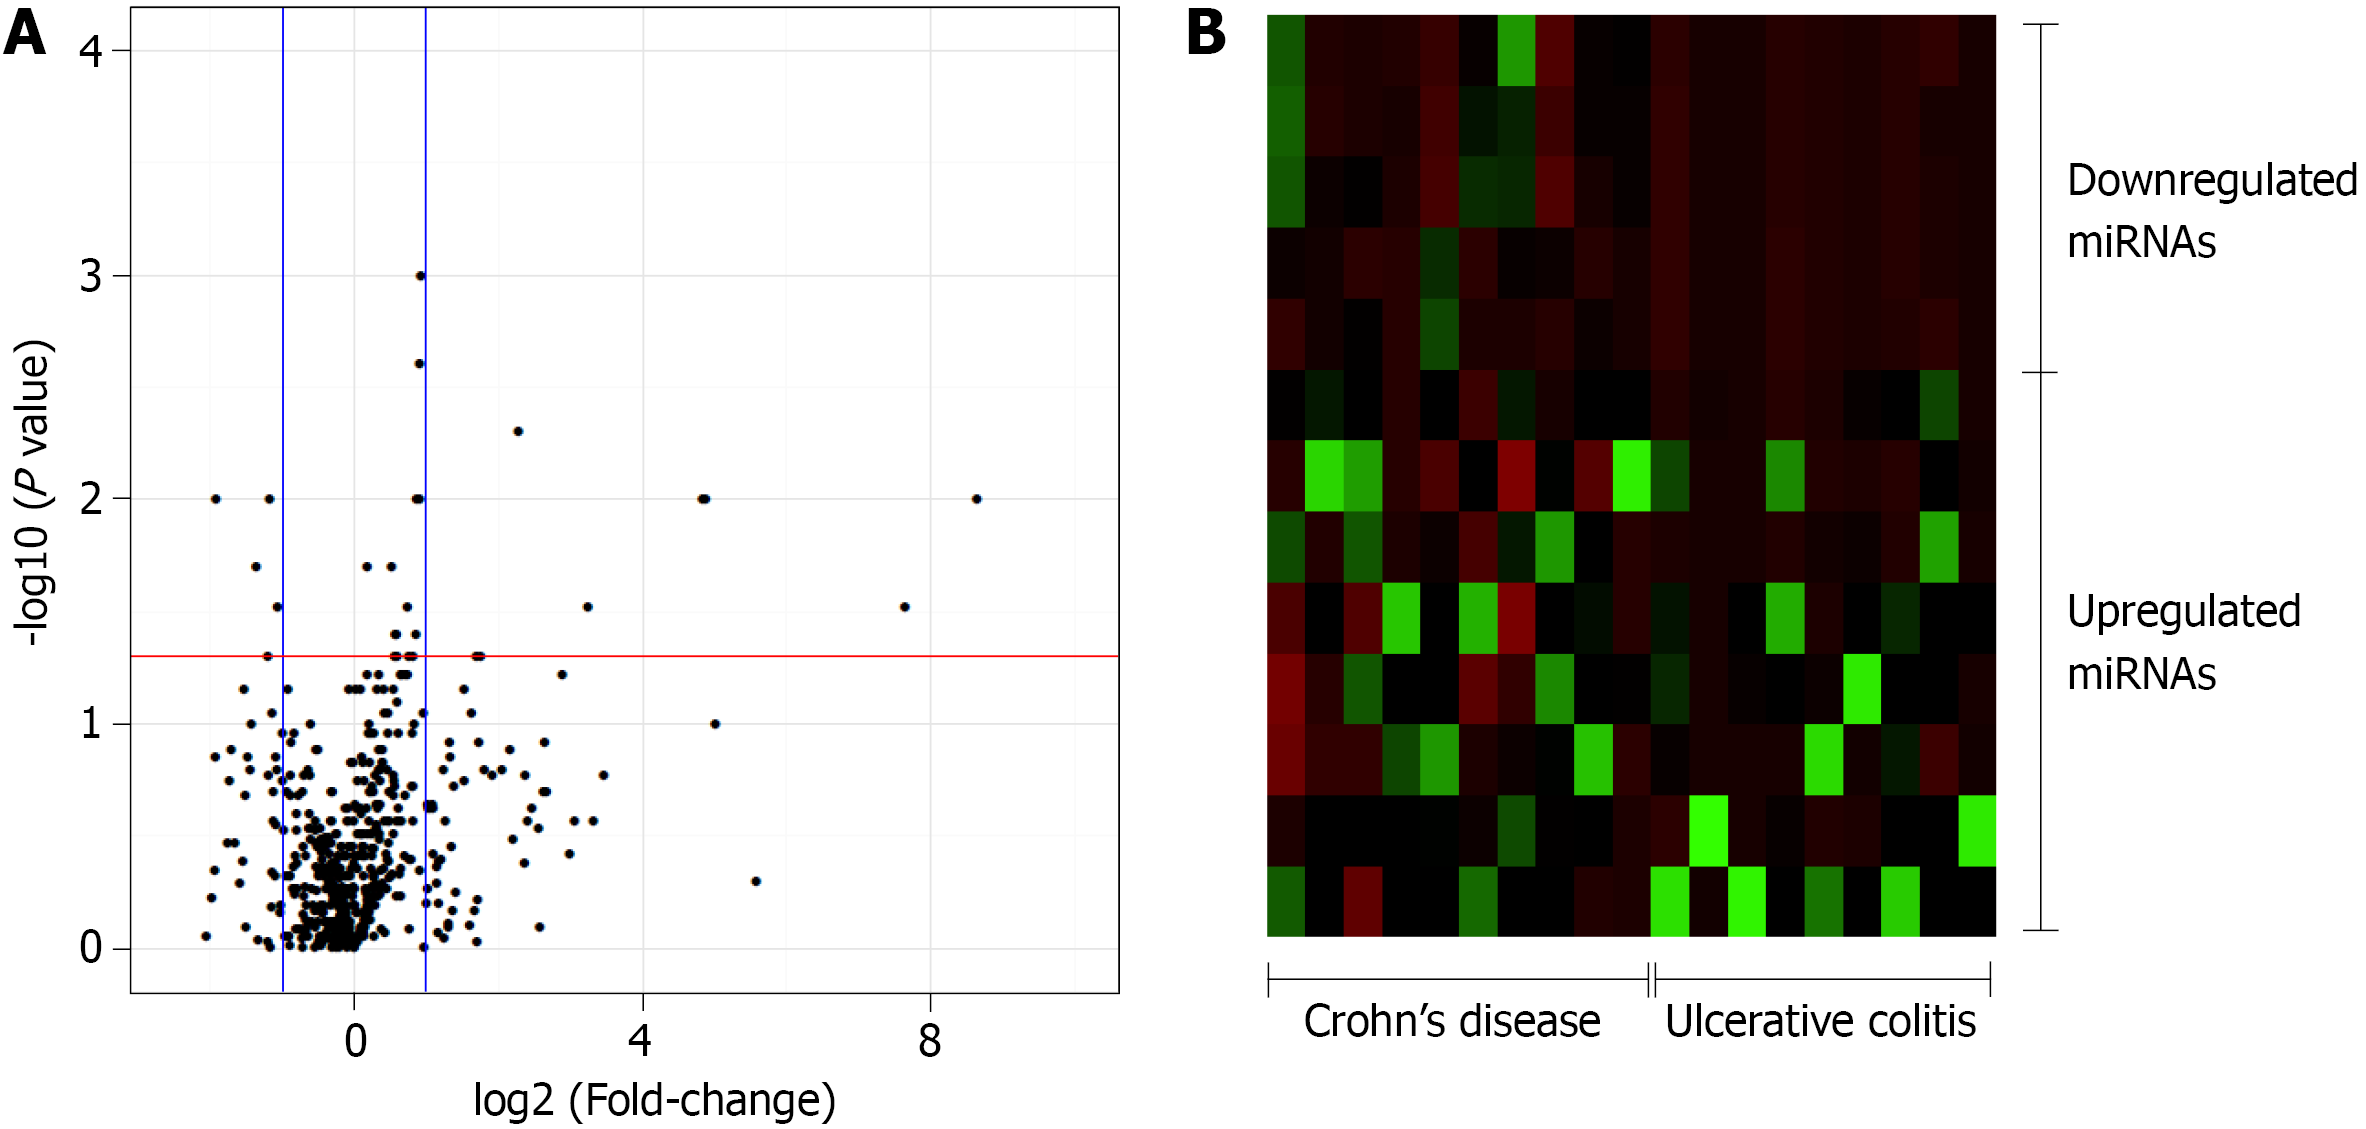
Figure 1 Volcano plot and heat map of the patients.
A: Volcano plot of the 754-microRNA (miRNA) analyzed in inflammatory bowel disease patients. Control group: Crohn’s disease (CD). Threshold x: fold change = 1; Threshold y: P ≤ 0.05; B: Heat map of the 13 significantly different miRNA between the CD and ulcerative colitis patients with a fold-change in expression level greater than 1 relatively to the expression levels in CD patients (8 upregulated and 5 downregulated). miRNA: MicroRNA.
- Citation: Quaglio AEV, Santaella FJ, Rodrigues MAM, Sassaki LY, Di Stasi LC. MicroRNAs expression influence in ulcerative colitis and Crohn's disease: A pilot study for the identification of diagnostic biomarkers. World J Gastroenterol 2021; 27(45): 7801-7812
- URL: https://www.wjgnet.com/1007-9327/full/v27/i45/7801.htm
- DOI: https://dx.doi.org/10.3748/wjg.v27.i45.7801


