Copyright
©The Author(s) 2021.
World J Gastroenterol. Nov 14, 2021; 27(42): 7387-7401
Published online Nov 14, 2021. doi: 10.3748/wjg.v27.i42.7387
Published online Nov 14, 2021. doi: 10.3748/wjg.v27.i42.7387
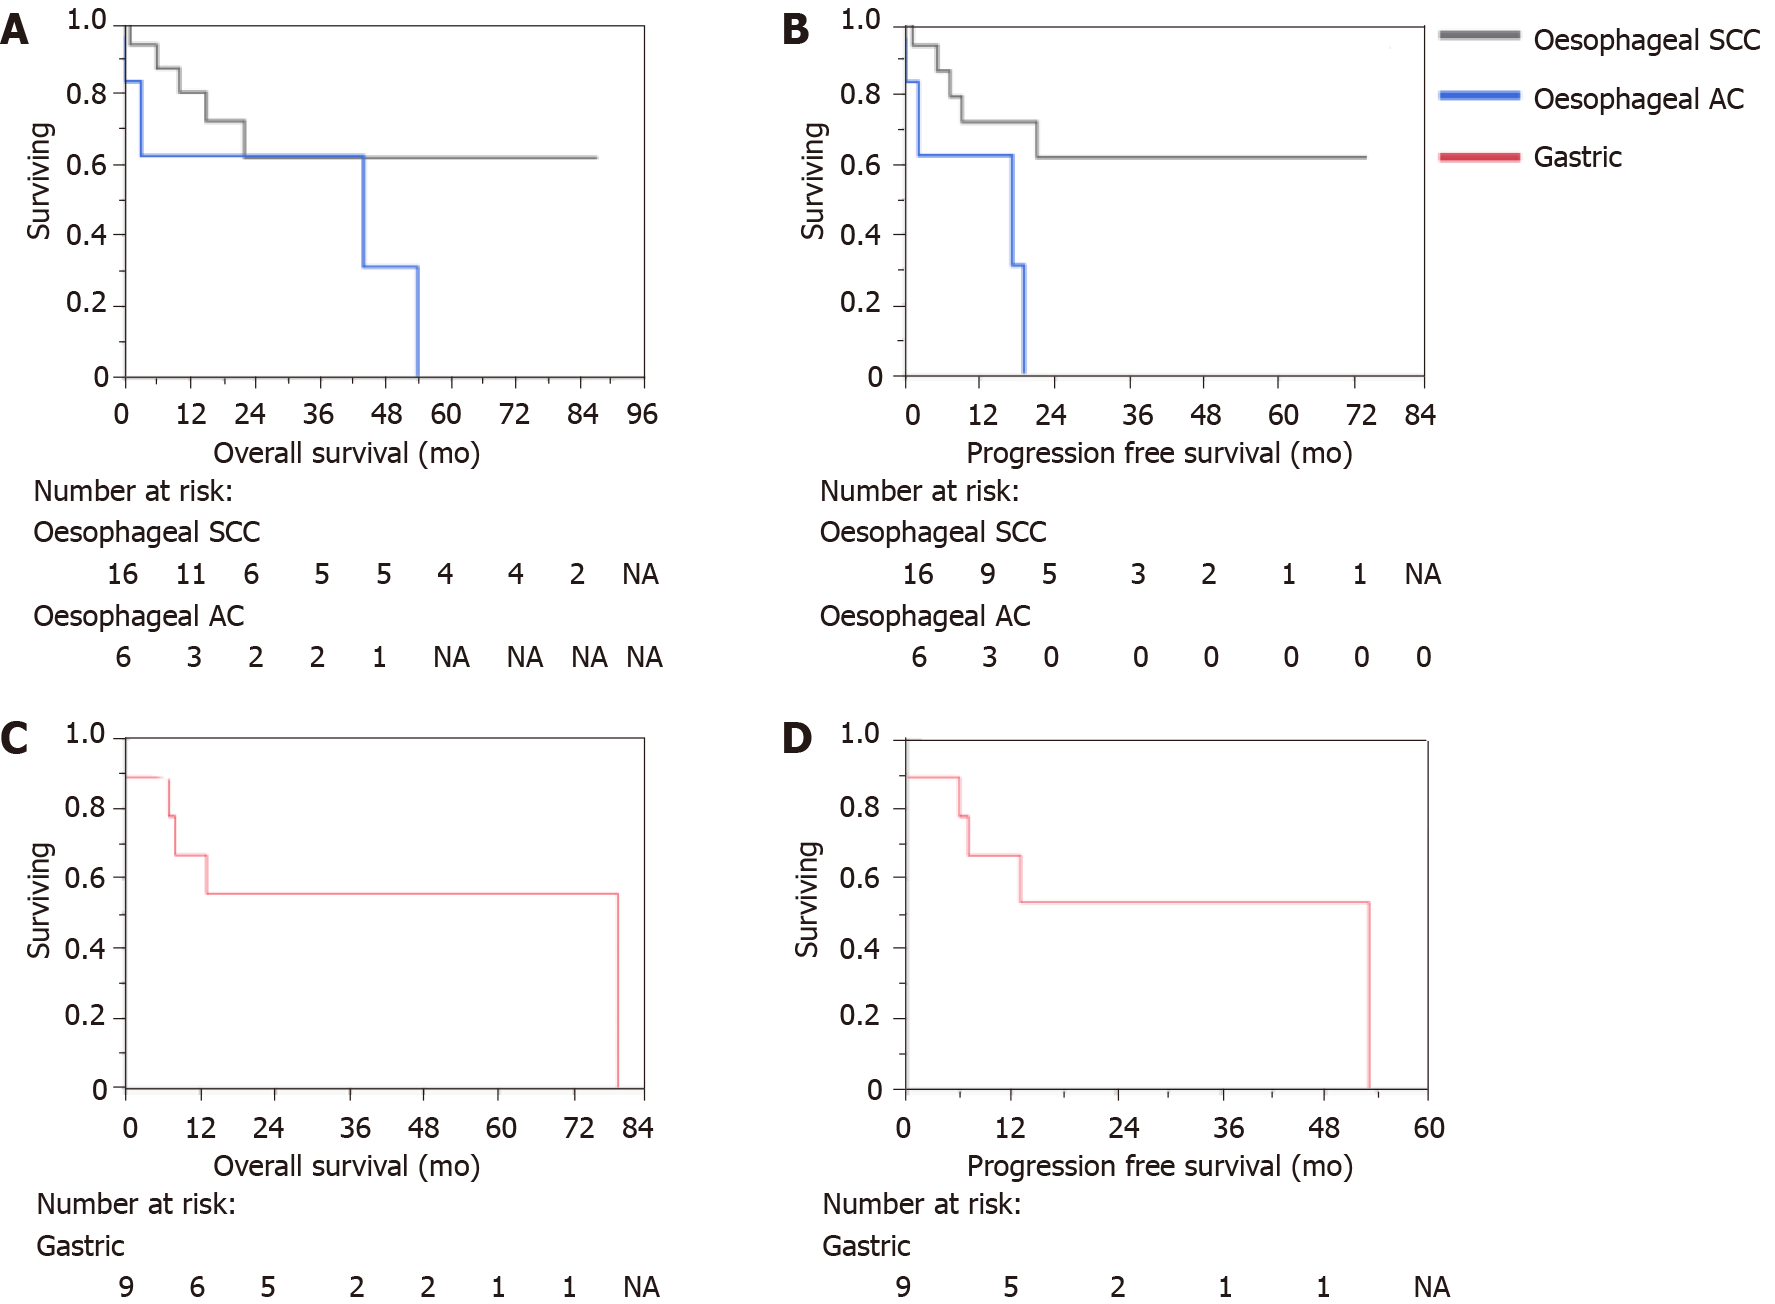
Figure 4 Kaplan Meier curve-site and histopathology.
A: The Kaplan-Meier curve for the overall survival (OS) of patients with oesophageal squamous cell carcinoma (SCC) and adenocarcinoma (AC); B: The Kaplan-Meier curve for the progression free survival (PFS) of patients with oesophageal SCC and AC; C: The Kaplan-Meier curve for the OS of patients with gastric AC; D: The Kaplan-Meier curve for the PFS of patients with gastric AC. NA: Not applicable; SCC: Squamous cell carcinoma; AC: Adenocarcinoma.
- Citation: Be KH, Khor R, Lim Joon D, Starvaggi B, Chao M, Ng SP, Ng M, Zorron Cheng Tao Pu L, Efthymiou M, Vaughan R, Chandran S. Long-term clinical outcomes of lipiodol marking using standard gastroscopy for image-guided radiotherapy of upper gastrointestinal cancers. World J Gastroenterol 2021; 27(42): 7387-7401
- URL: https://www.wjgnet.com/1007-9327/full/v27/i42/7387.htm
- DOI: https://dx.doi.org/10.3748/wjg.v27.i42.7387


