Copyright
©The Author(s) 2021.
World J Gastroenterol. Nov 14, 2021; 27(42): 7340-7349
Published online Nov 14, 2021. doi: 10.3748/wjg.v27.i42.7340
Published online Nov 14, 2021. doi: 10.3748/wjg.v27.i42.7340
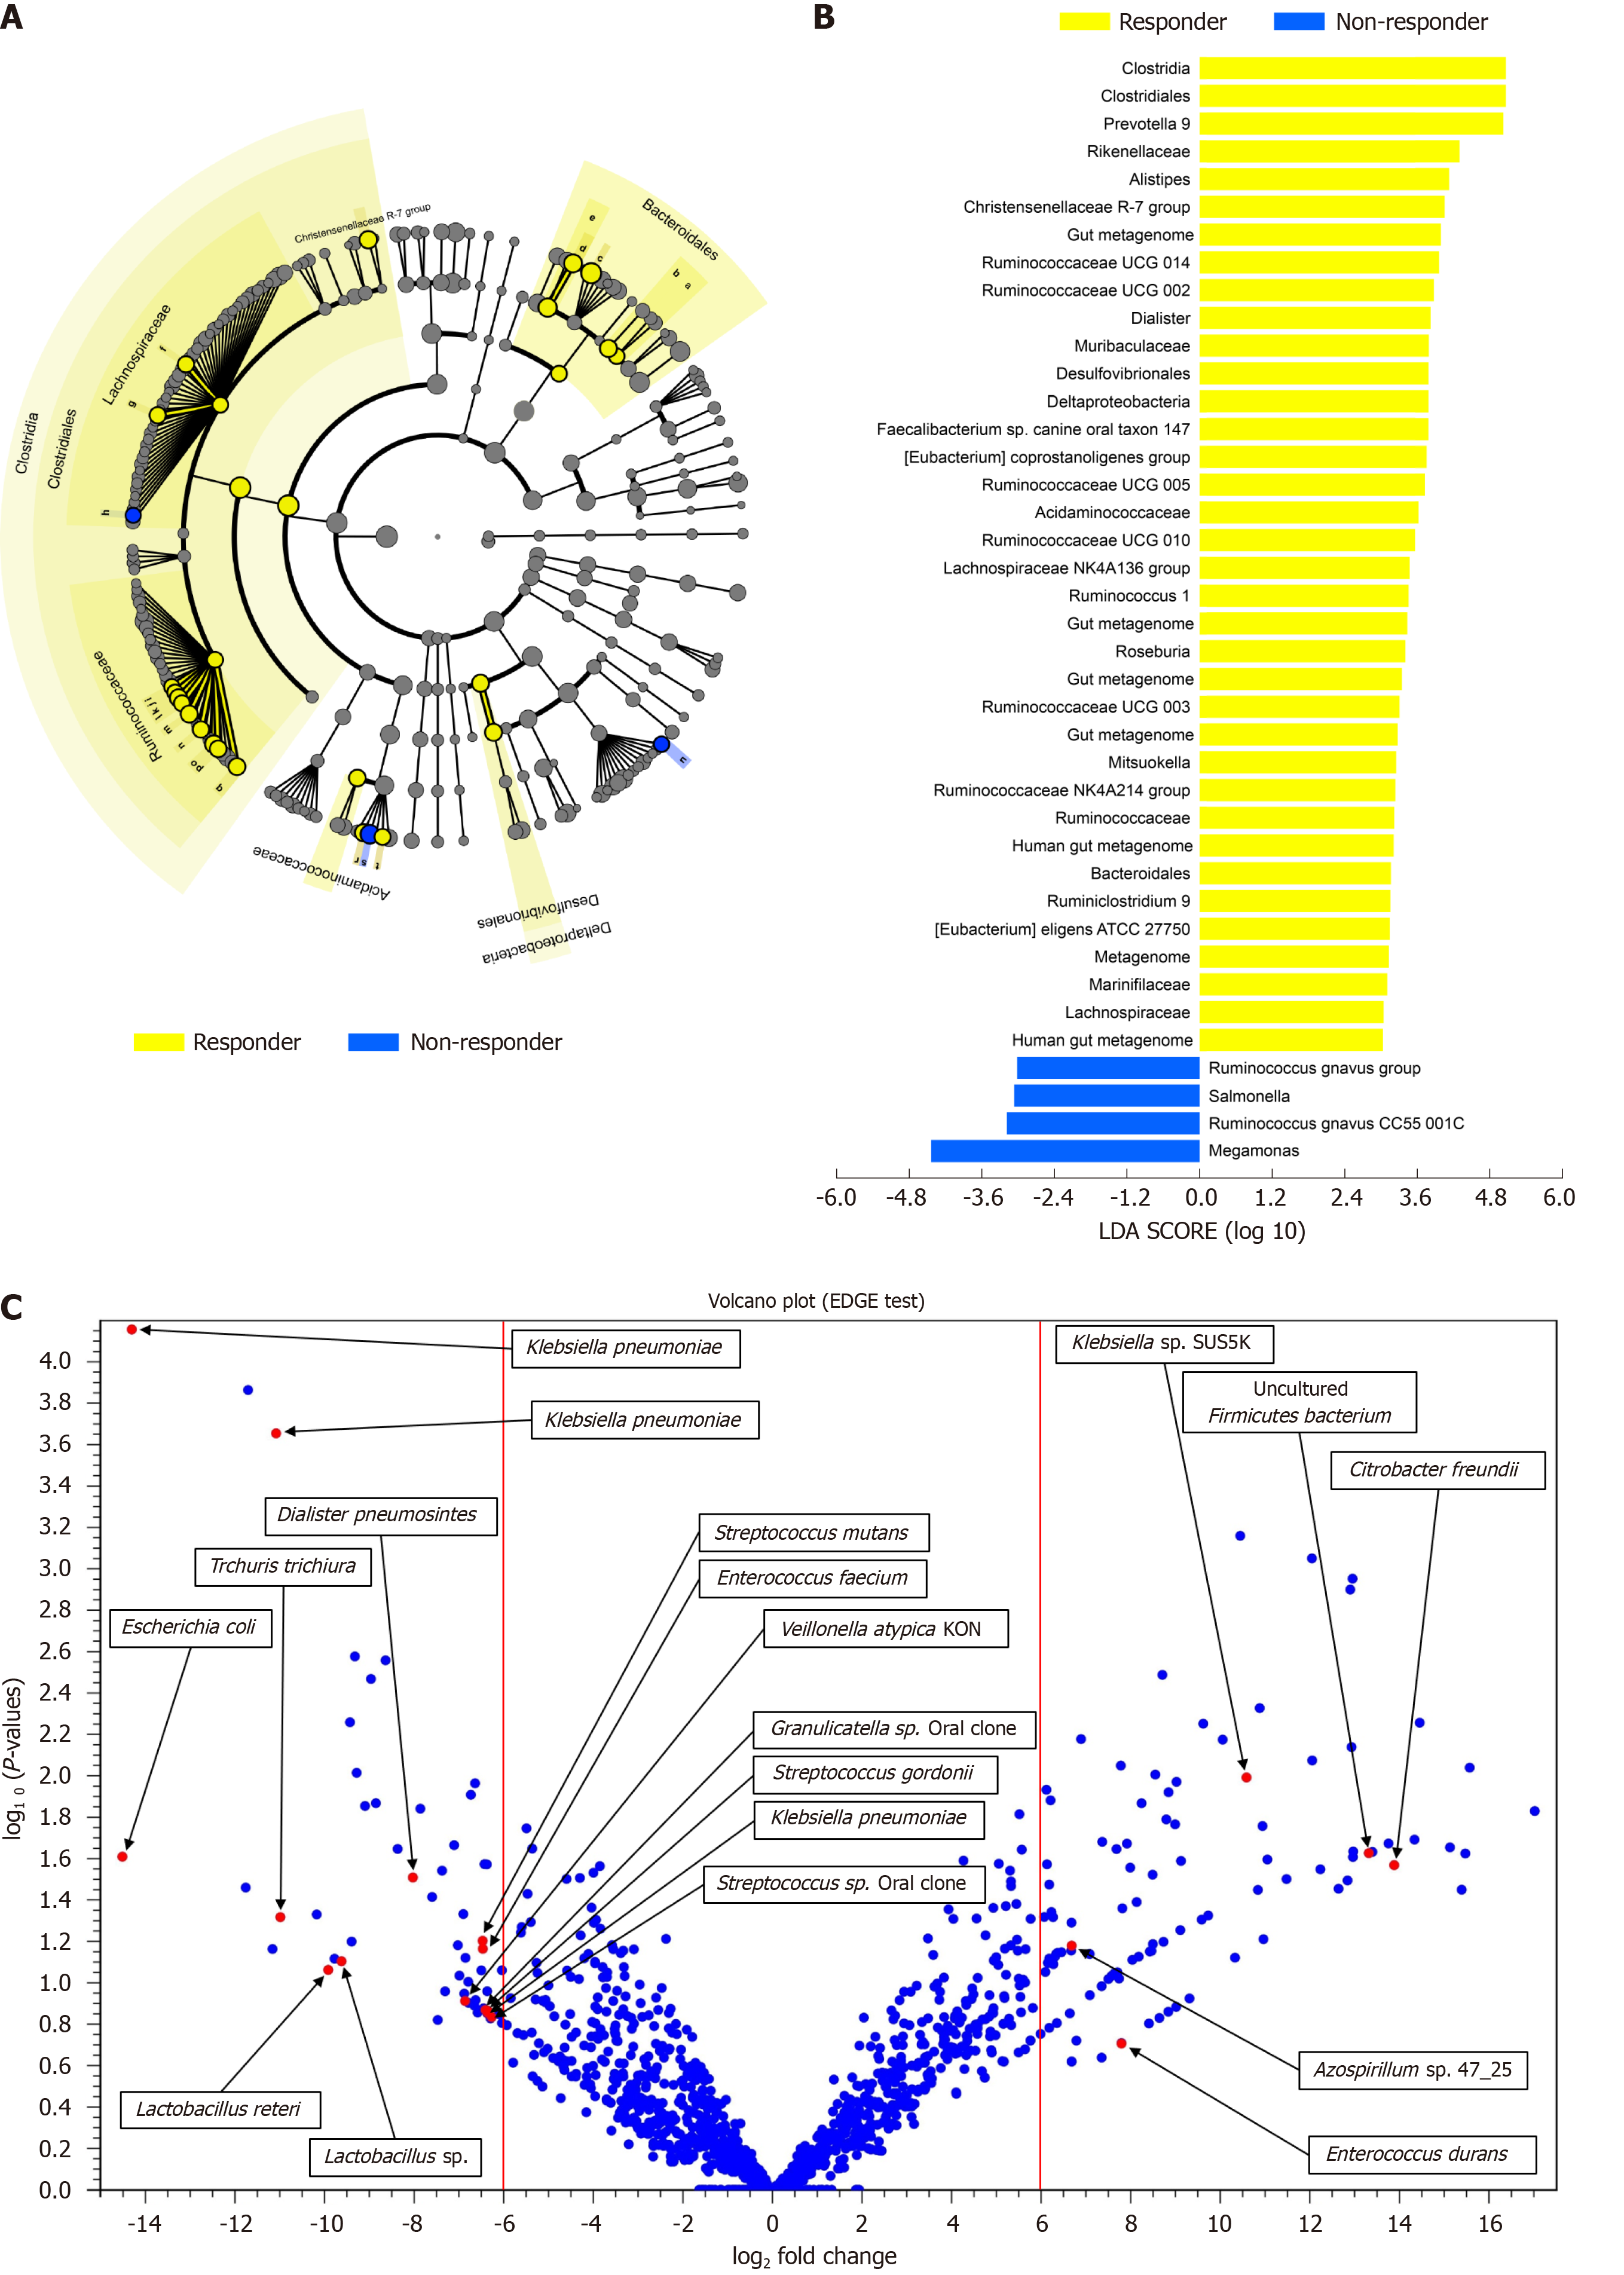
Figure 3 Specific bacterial taxa are associated with the prognosis of nivolumab therapy in hepatocellular carcinoma patients according to linear discriminant analysis effect size analysis.
A: Taxonomic cladogram based on linear discriminant analysis (LDA) using effect size (LEfSe) showing differences in fecal taxa. Dot size is proportional to the abundance of the taxon. Letters correspond to the following taxa: (a) Marinifilaceae, (b) Muribaculaceae, (c) Prevotella 9, (d) Alistipes, (e) Rikenellaceae, (f) the Lachnospiraceae NK4A136 group, (g) Roseburia, (h) the [Ruminococcus]gnavus group, (i) Ruminiclostridium 9, (j) the Ruminococcaceae NK4A214 group, (k) Ruminococcaceae UCG-002, (l) Ruminococcaceae UCG-003, (m) Ruminococcaceae UCG-005, (n) Ruminococcaceae UCG-010, (o) Ruminococcaceae UCG-014, (p) Ruminococcus 1, the (q) [Eubacterium]coprostanoligenes group, (r) Dialister, (s) Megamonas, (t) Mitsuokella, and (u) Salmonella; B: LDA scores for the differentially abundant taxa in the fecal microbiome of responders (yellow) and non-responders (blue). The length denotes the effect size for a taxon. P = 0.05 for the Kruskal-Wallis test; LDA score > 3; C: Volcano plot showing several bacterial taxa specifically related to the prognosis of nivolumab therapy in hepatocellular carcinoma patients. LDA: Linear discriminant analysis.
- Citation: Chung MW, Kim MJ, Won EJ, Lee YJ, Yun YW, Cho SB, Joo YE, Hwang JE, Bae WK, Chung IJ, Shin MG, Shin JH. Gut microbiome composition can predict the response to nivolumab in advanced hepatocellular carcinoma patients. World J Gastroenterol 2021; 27(42): 7340-7349
- URL: https://www.wjgnet.com/1007-9327/full/v27/i42/7340.htm
- DOI: https://dx.doi.org/10.3748/wjg.v27.i42.7340


