Copyright
©The Author(s) 2021.
World J Gastroenterol. Nov 7, 2021; 27(41): 7173-7189
Published online Nov 7, 2021. doi: 10.3748/wjg.v27.i41.7173
Published online Nov 7, 2021. doi: 10.3748/wjg.v27.i41.7173
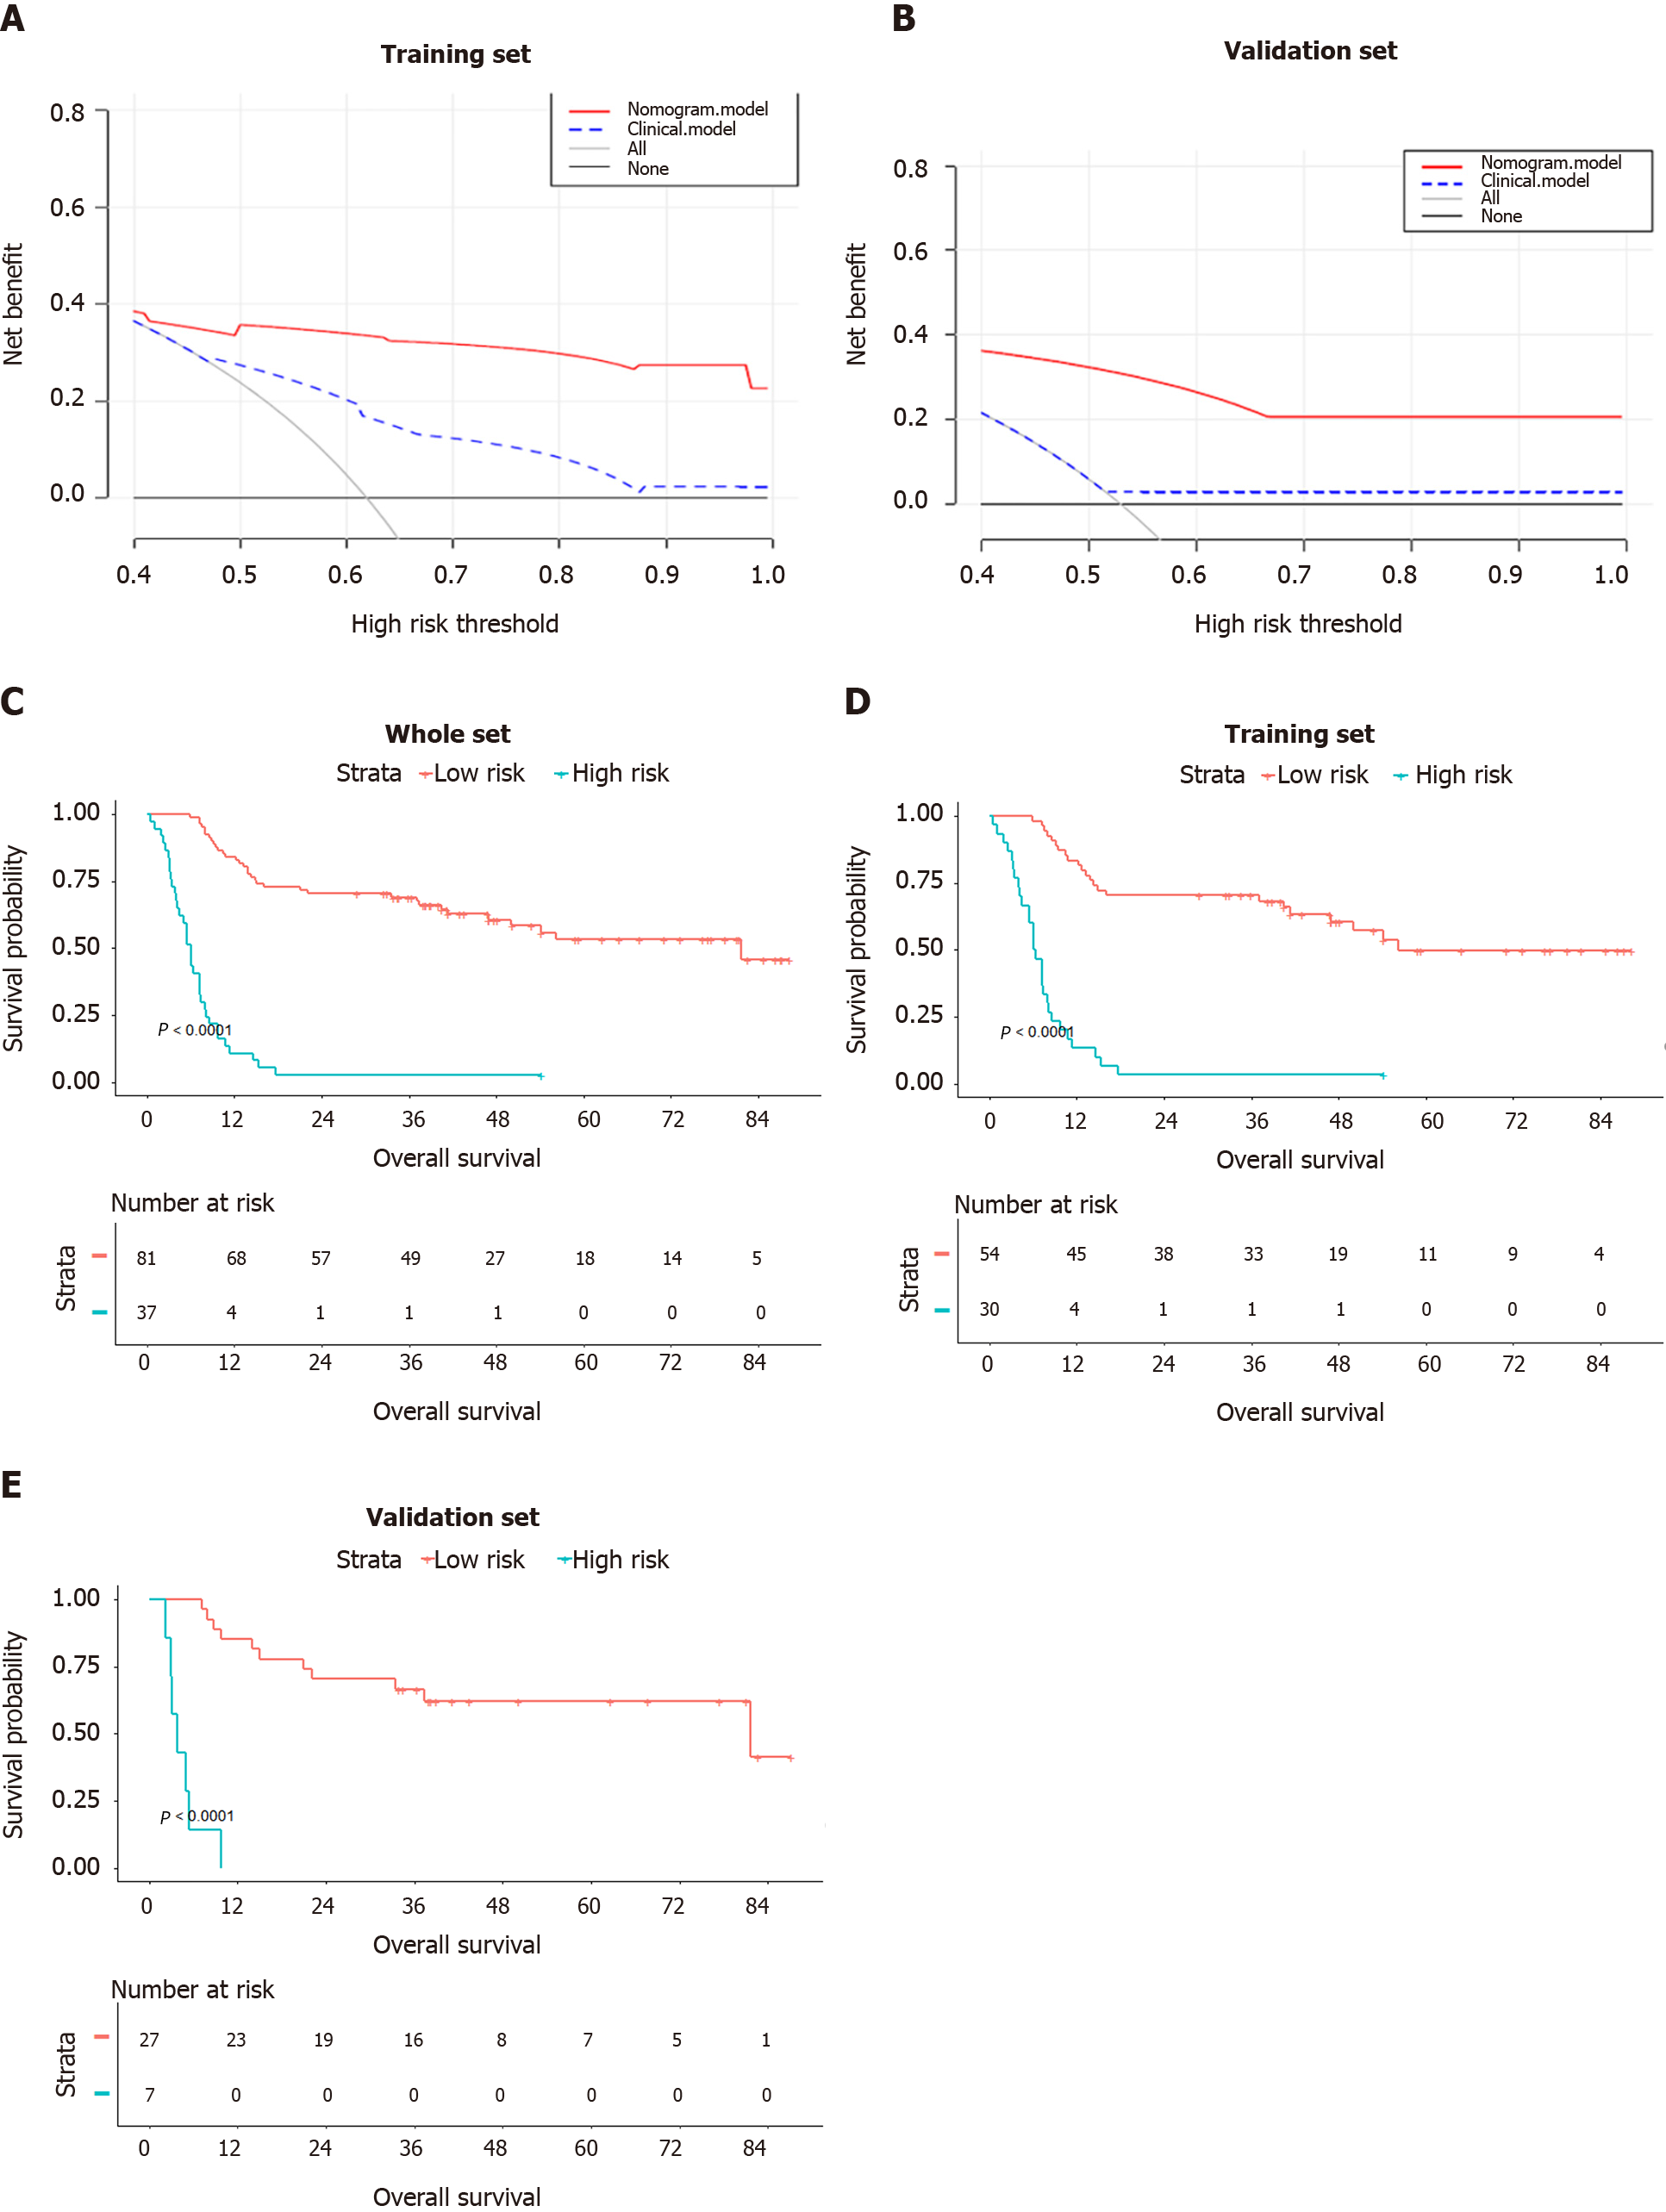
Figure 6 Clinical usefulness of the radiomics nomogram.
A and B: Decision curve analysis assessing the ability of the radiomics nomogram or a model based on four clinical factors to predict overall survival (OS) in the training and validation sets. The y-axis indicates “net benefit”; the red line, the radiomics nomogram; the blue dotted line, the model based on clinical factors; the gray dotted line, the result in the event that all patients died; and the black dotted line, the result in the event that no patient died; C-E: OS comparison between patients classified by the radiomics nomogram as at “low risk” or “high risk” of poor OS; C: All patients; D: The training set; and E: The validation set.
- Citation: Tang YY, Zhao YN, Zhang T, Chen ZY, Ma XL. Comprehensive radiomics nomogram for predicting survival of patients with combined hepatocellular carcinoma and cholangiocarcinoma. World J Gastroenterol 2021; 27(41): 7173-7189
- URL: https://www.wjgnet.com/1007-9327/full/v27/i41/7173.htm
- DOI: https://dx.doi.org/10.3748/wjg.v27.i41.7173


