Copyright
©The Author(s) 2021.
World J Gastroenterol. Oct 21, 2021; 27(39): 6673-6688
Published online Oct 21, 2021. doi: 10.3748/wjg.v27.i39.6673
Published online Oct 21, 2021. doi: 10.3748/wjg.v27.i39.6673
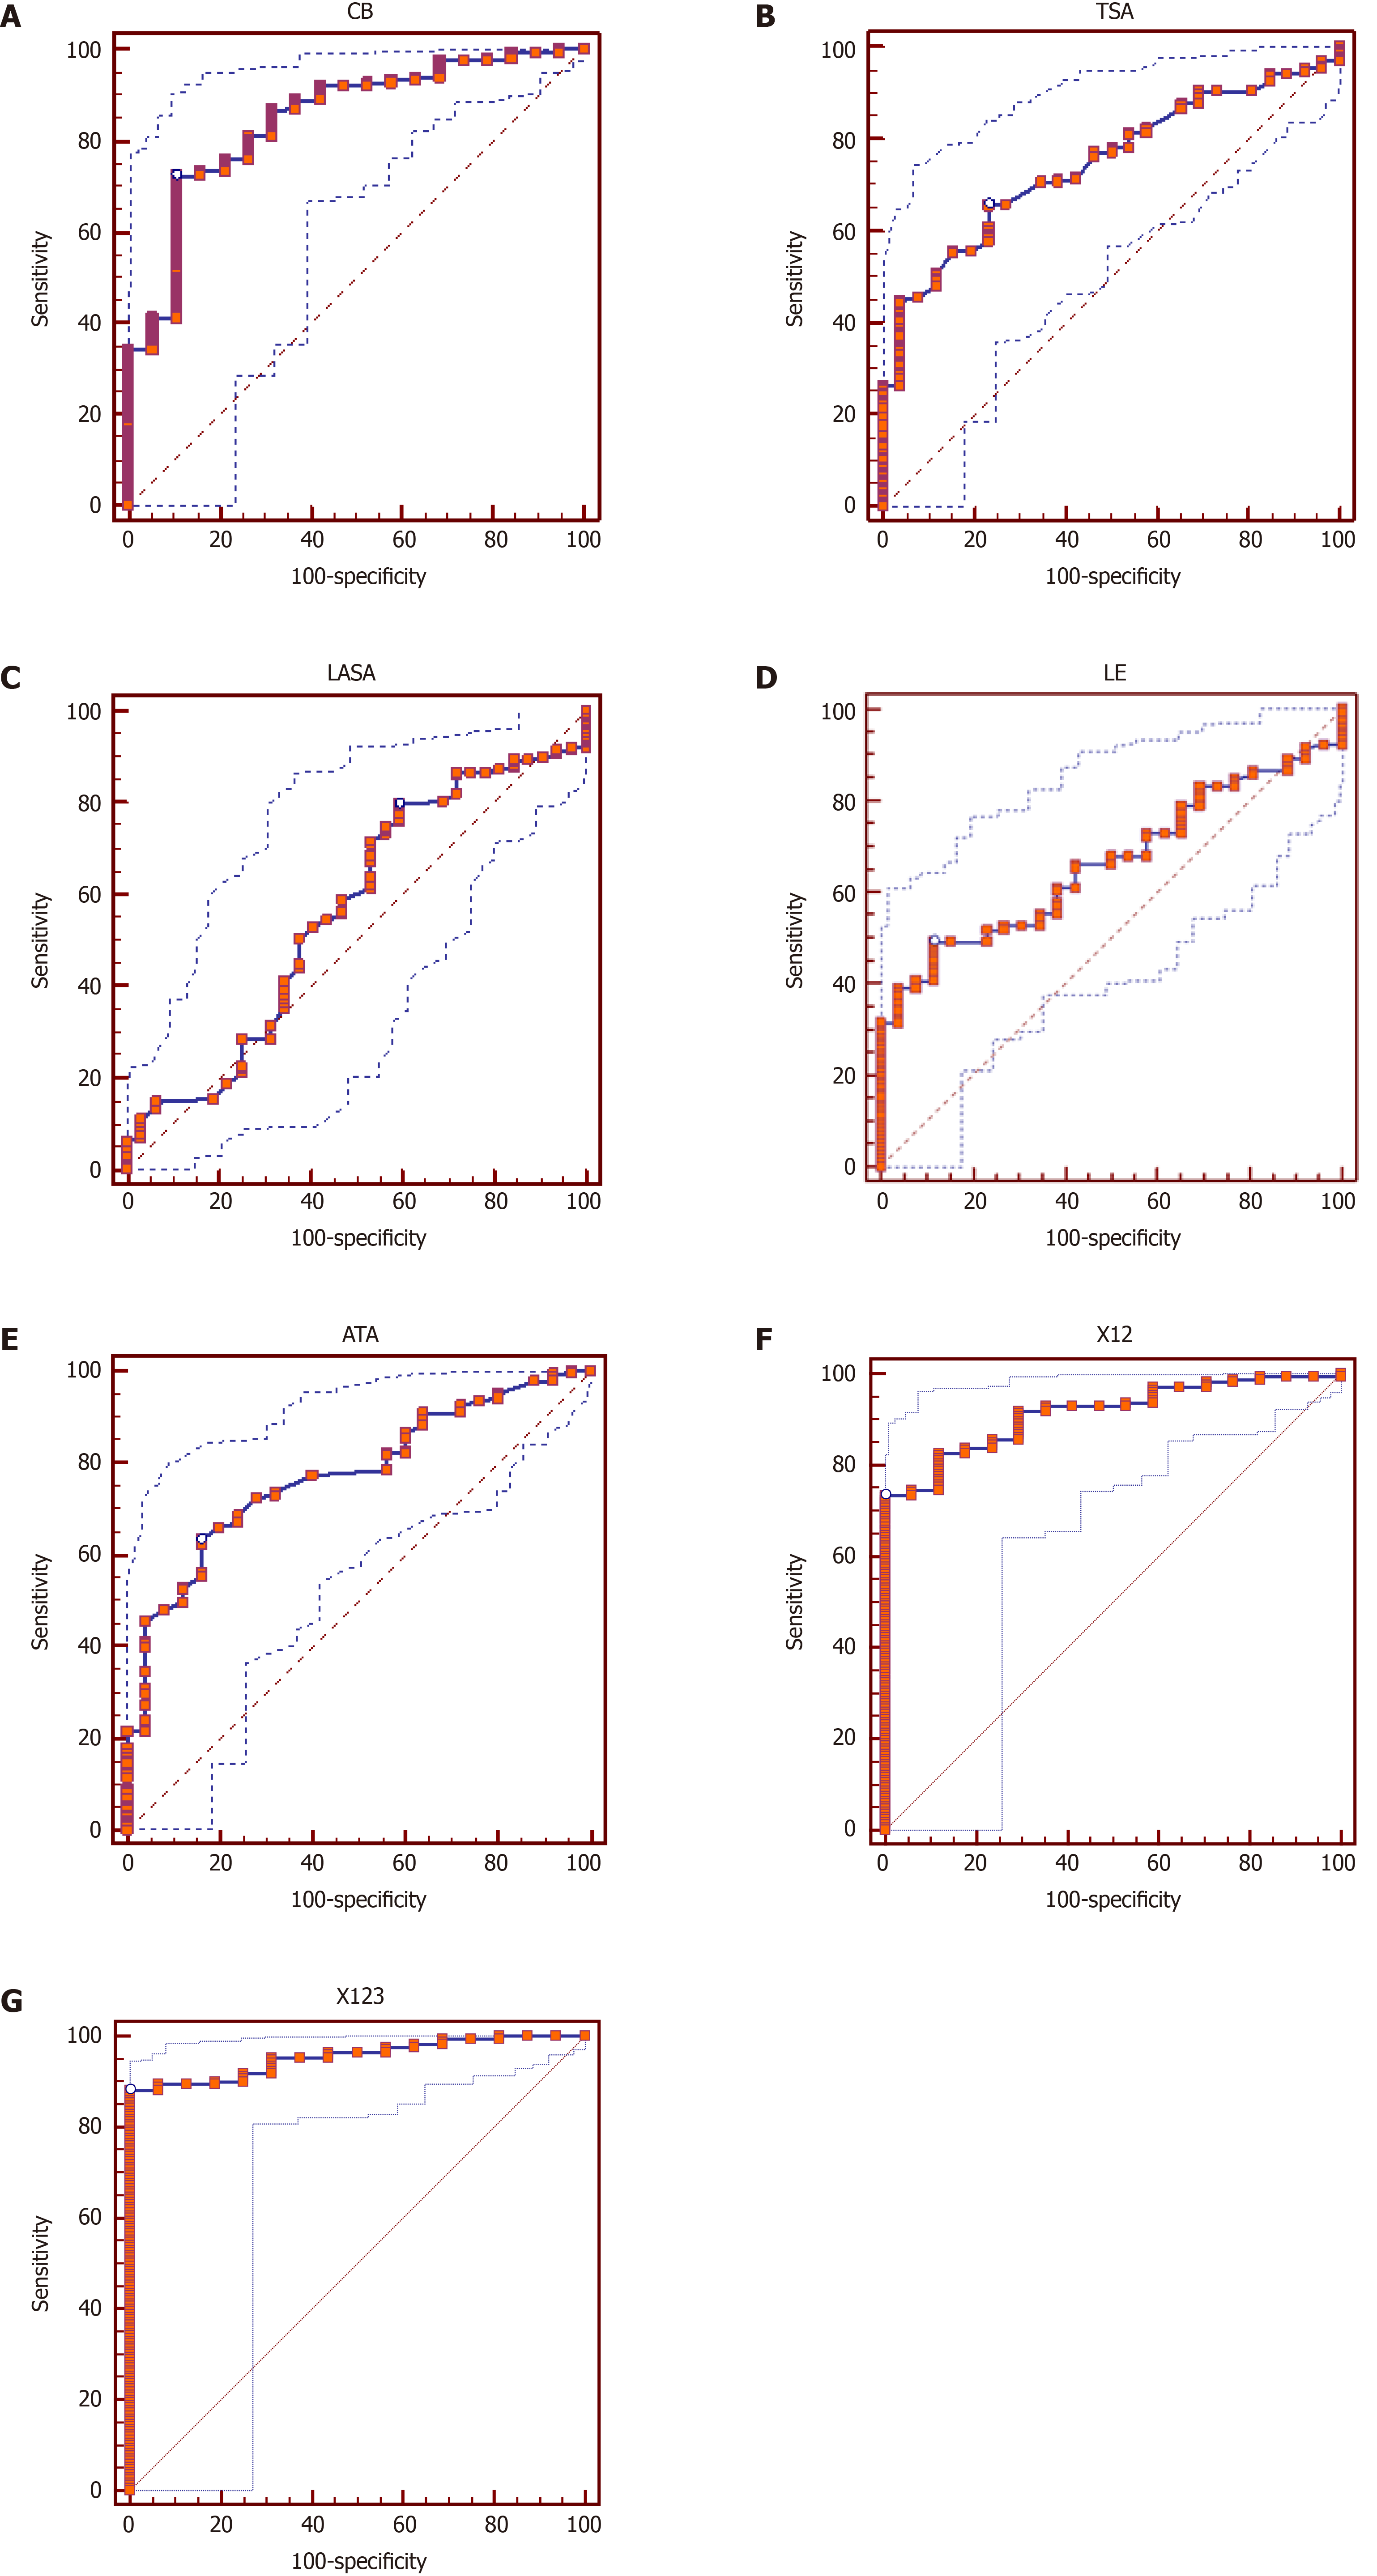
Figure 1 Diagram of receiver operating characteristic curve.
A: For cathepsin B (CB). Threshold value of > 11.22 mU/L yielded sensitivity of 72.3% and specificity of 90%. Area under the receiver operating characteristic curve = 0.85; B: For total sialic acid (TSA). Threshold value > 75.34 mg% yielded sensitivity of 65.8% and specificity of 76.9%. Area under the receiver operating characteristic curve = 0.75; C: For lipid-bound sialic acid (LASA). Threshold value > 0.739 mg% yielded sensitivity of 79.7% and specificity of 40.6%. Area under the receiver operating characteristic curve = 0.56; D: For leukocytic elastase (LE). Threshold value > 543 µg/L yielded sensitivity of 49.2% and specificity of 88.5%. Area under the receiver operating characteristic curve = 0.56; E: For antitrypsin activity (ATA). Threshold value > 2400 U/mL yielded sensitivity of 63.2% and specificity of 84.0%. Area under the receiver operating characteristic curve = 0.77; F: For the combined two biochemical parameters. Threshold value > 0.4757 yielded sensitivity of 73.4% and specificity of 100%. Area under the receiver operating characteristic curve = 0.91; G: The three parameters combined (X123): CB, TSA, and ATA. Threshold value > 1.3457 yielded sensitivity of 88.2% and specificity of 100%. Area under the receiver operating characteristic curve = 0.95.
- Citation: Sebzda T, Gnus J, Dziadkowiec B, Latka M, Gburek J. Diagnostic usefulness of selected proteases and acute phase factors in patients with colorectal adenocarcinoma. World J Gastroenterol 2021; 27(39): 6673-6688
- URL: https://www.wjgnet.com/1007-9327/full/v27/i39/6673.htm
- DOI: https://dx.doi.org/10.3748/wjg.v27.i39.6673


