Copyright
©The Author(s) 2021.
World J Gastroenterol. Oct 14, 2021; 27(38): 6430-6441
Published online Oct 14, 2021. doi: 10.3748/wjg.v27.i38.6430
Published online Oct 14, 2021. doi: 10.3748/wjg.v27.i38.6430
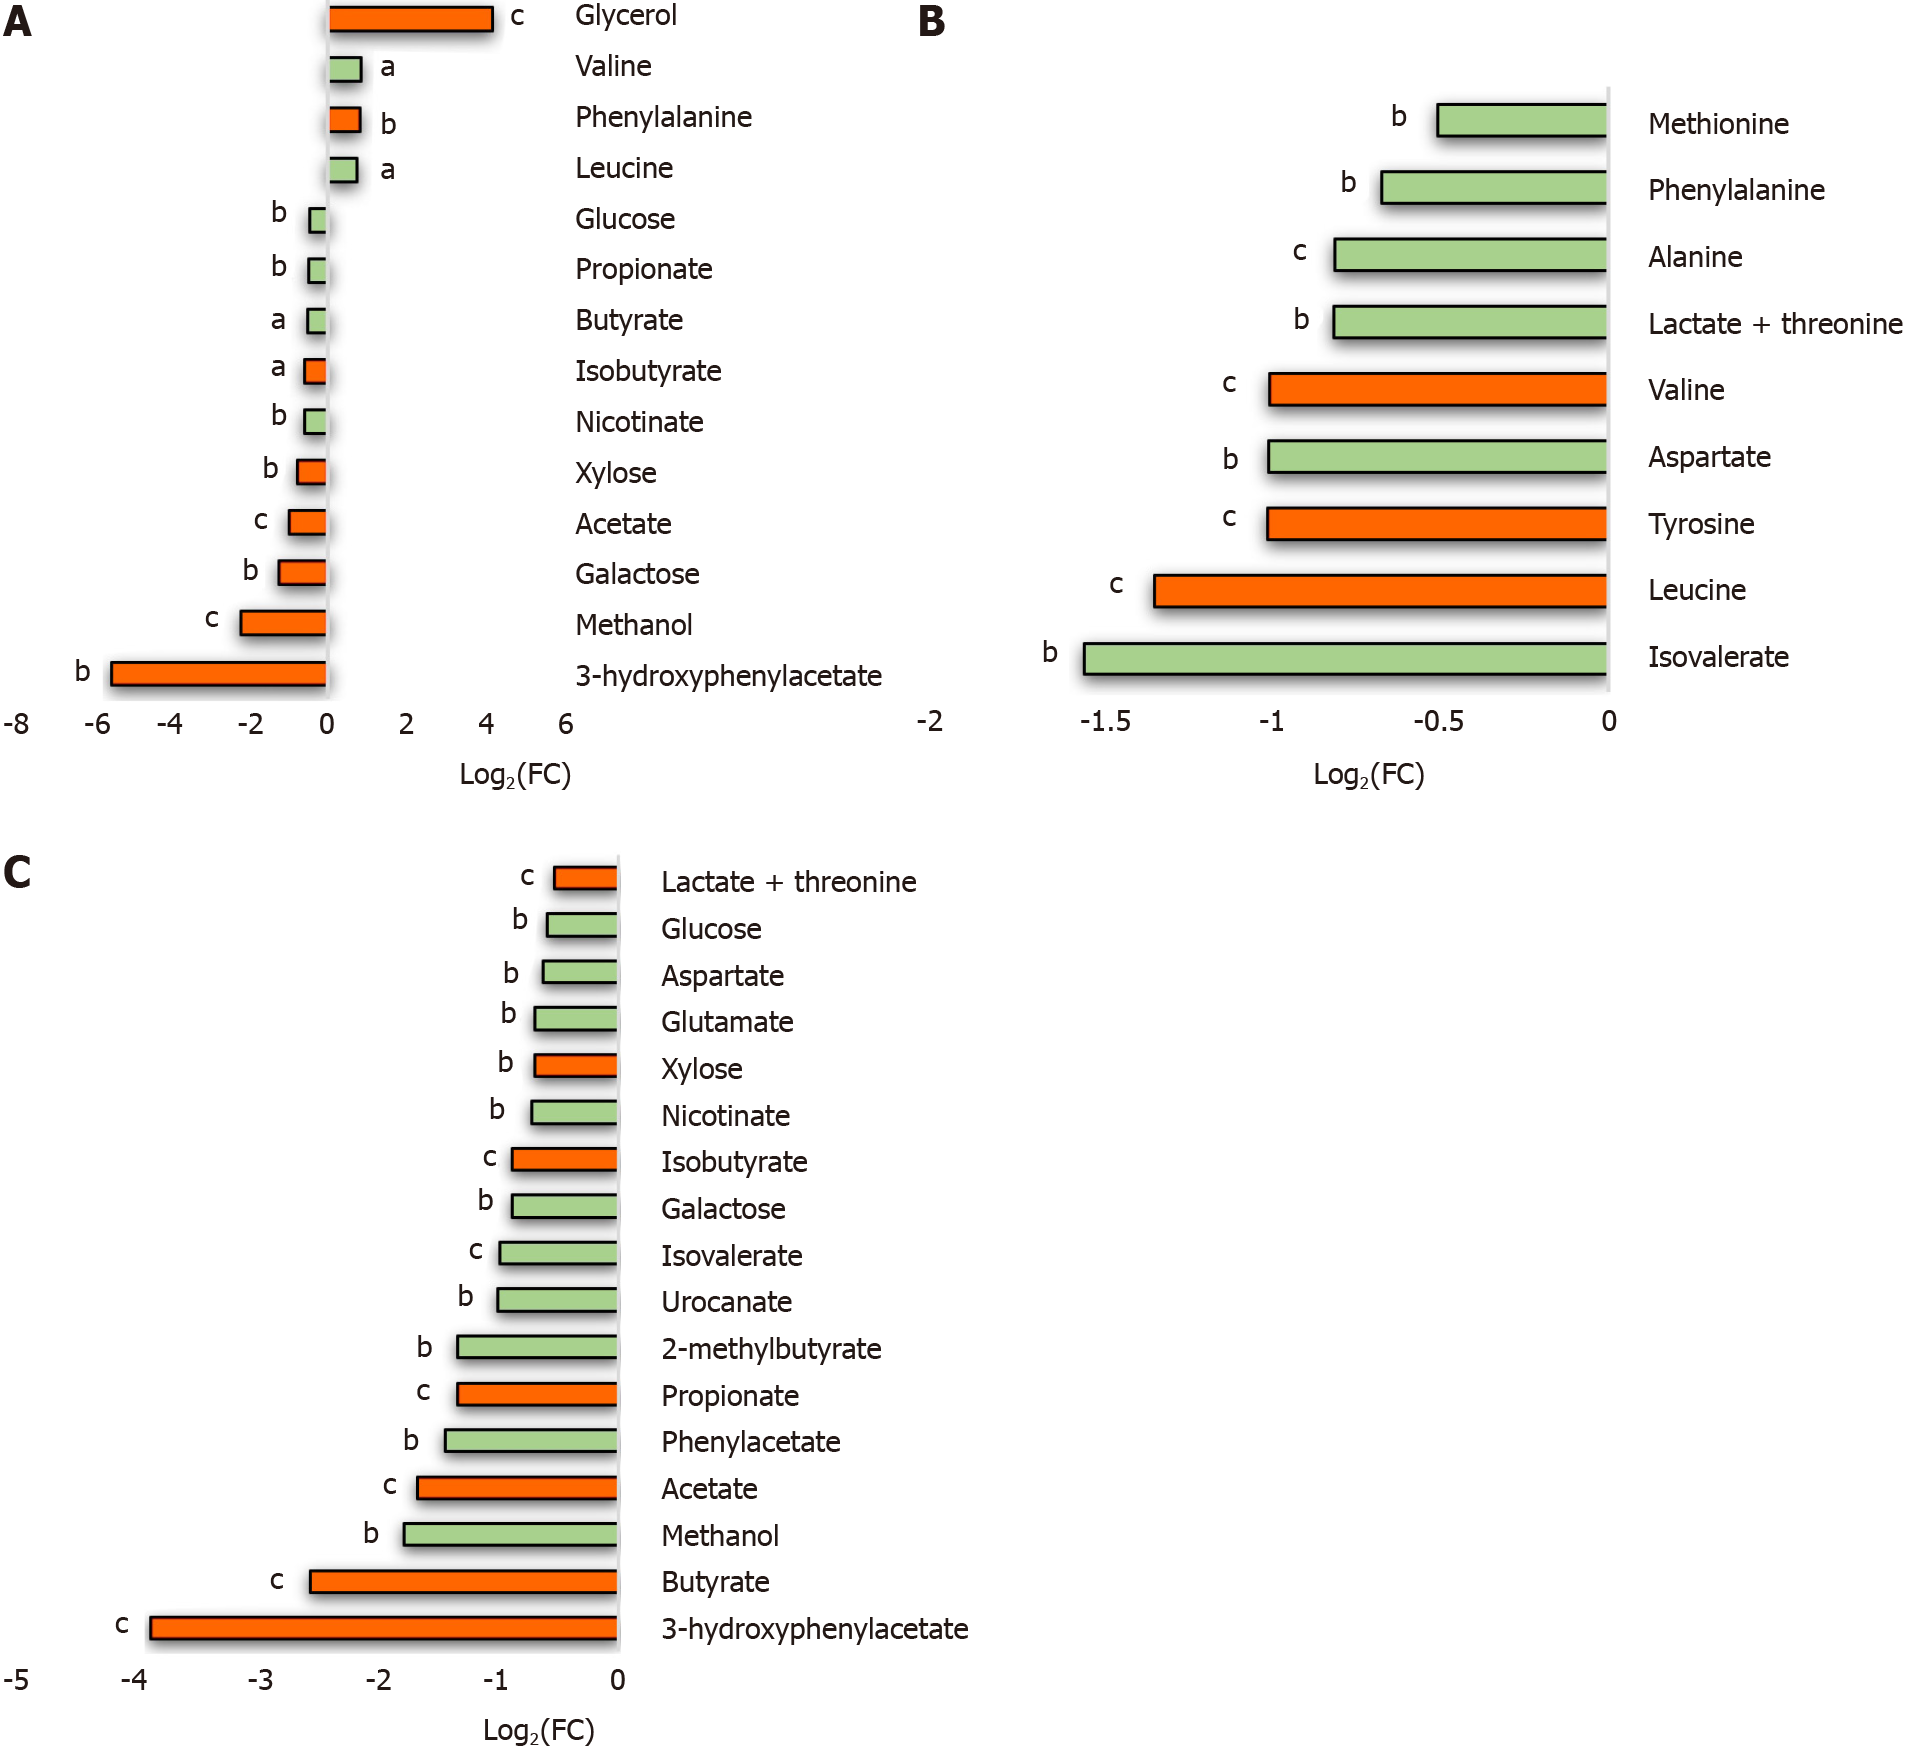
Figure 1 Fecal water metabolite levels of colorectal cancer, polyps’ patients and healthy controls.
Boxplots of fold-change (FC) values for the significantly altered metabolites. Red bars represent metabolites levels that remain significant after the false discovery rate (FDR) correction (FDR P < 0.05), green bars are the metabolites that are no more significant after the FDR correction (P < 0.05). Cliff’s delta effect size is also reported for each metabolites in the comparisons (a: Small effect, b: Medium effect, c: Large effect). A: Comparison between healthy controls (HCs) and colorectal cancer (CRC) patients, negative log2(FC) values mean lower metabolite levels in CRC fecal samples, positive log2(FC) values report higher content in CRC compared to HCs; B: Negative log2(FC) represent higher metabolite levels in CRC patients compared to polyp patients; C: Comparison between HCs and polyp patient-negative log2(FC) values mean lower metabolite levels in polyp patients fecal water.
- Citation: Nannini G, Meoni G, Tenori L, Ringressi MN, Taddei A, Niccolai E, Baldi S, Russo E, Luchinat C, Amedei A. Fecal metabolomic profiles: A comparative study of patients with colorectal cancer vs adenomatous polyps. World J Gastroenterol 2021; 27(38): 6430-6441
- URL: https://www.wjgnet.com/1007-9327/full/v27/i38/6430.htm
- DOI: https://dx.doi.org/10.3748/wjg.v27.i38.6430


