Copyright
©The Author(s) 2021.
World J Gastroenterol. Sep 28, 2021; 27(36): 6110-6127
Published online Sep 28, 2021. doi: 10.3748/wjg.v27.i36.6110
Published online Sep 28, 2021. doi: 10.3748/wjg.v27.i36.6110
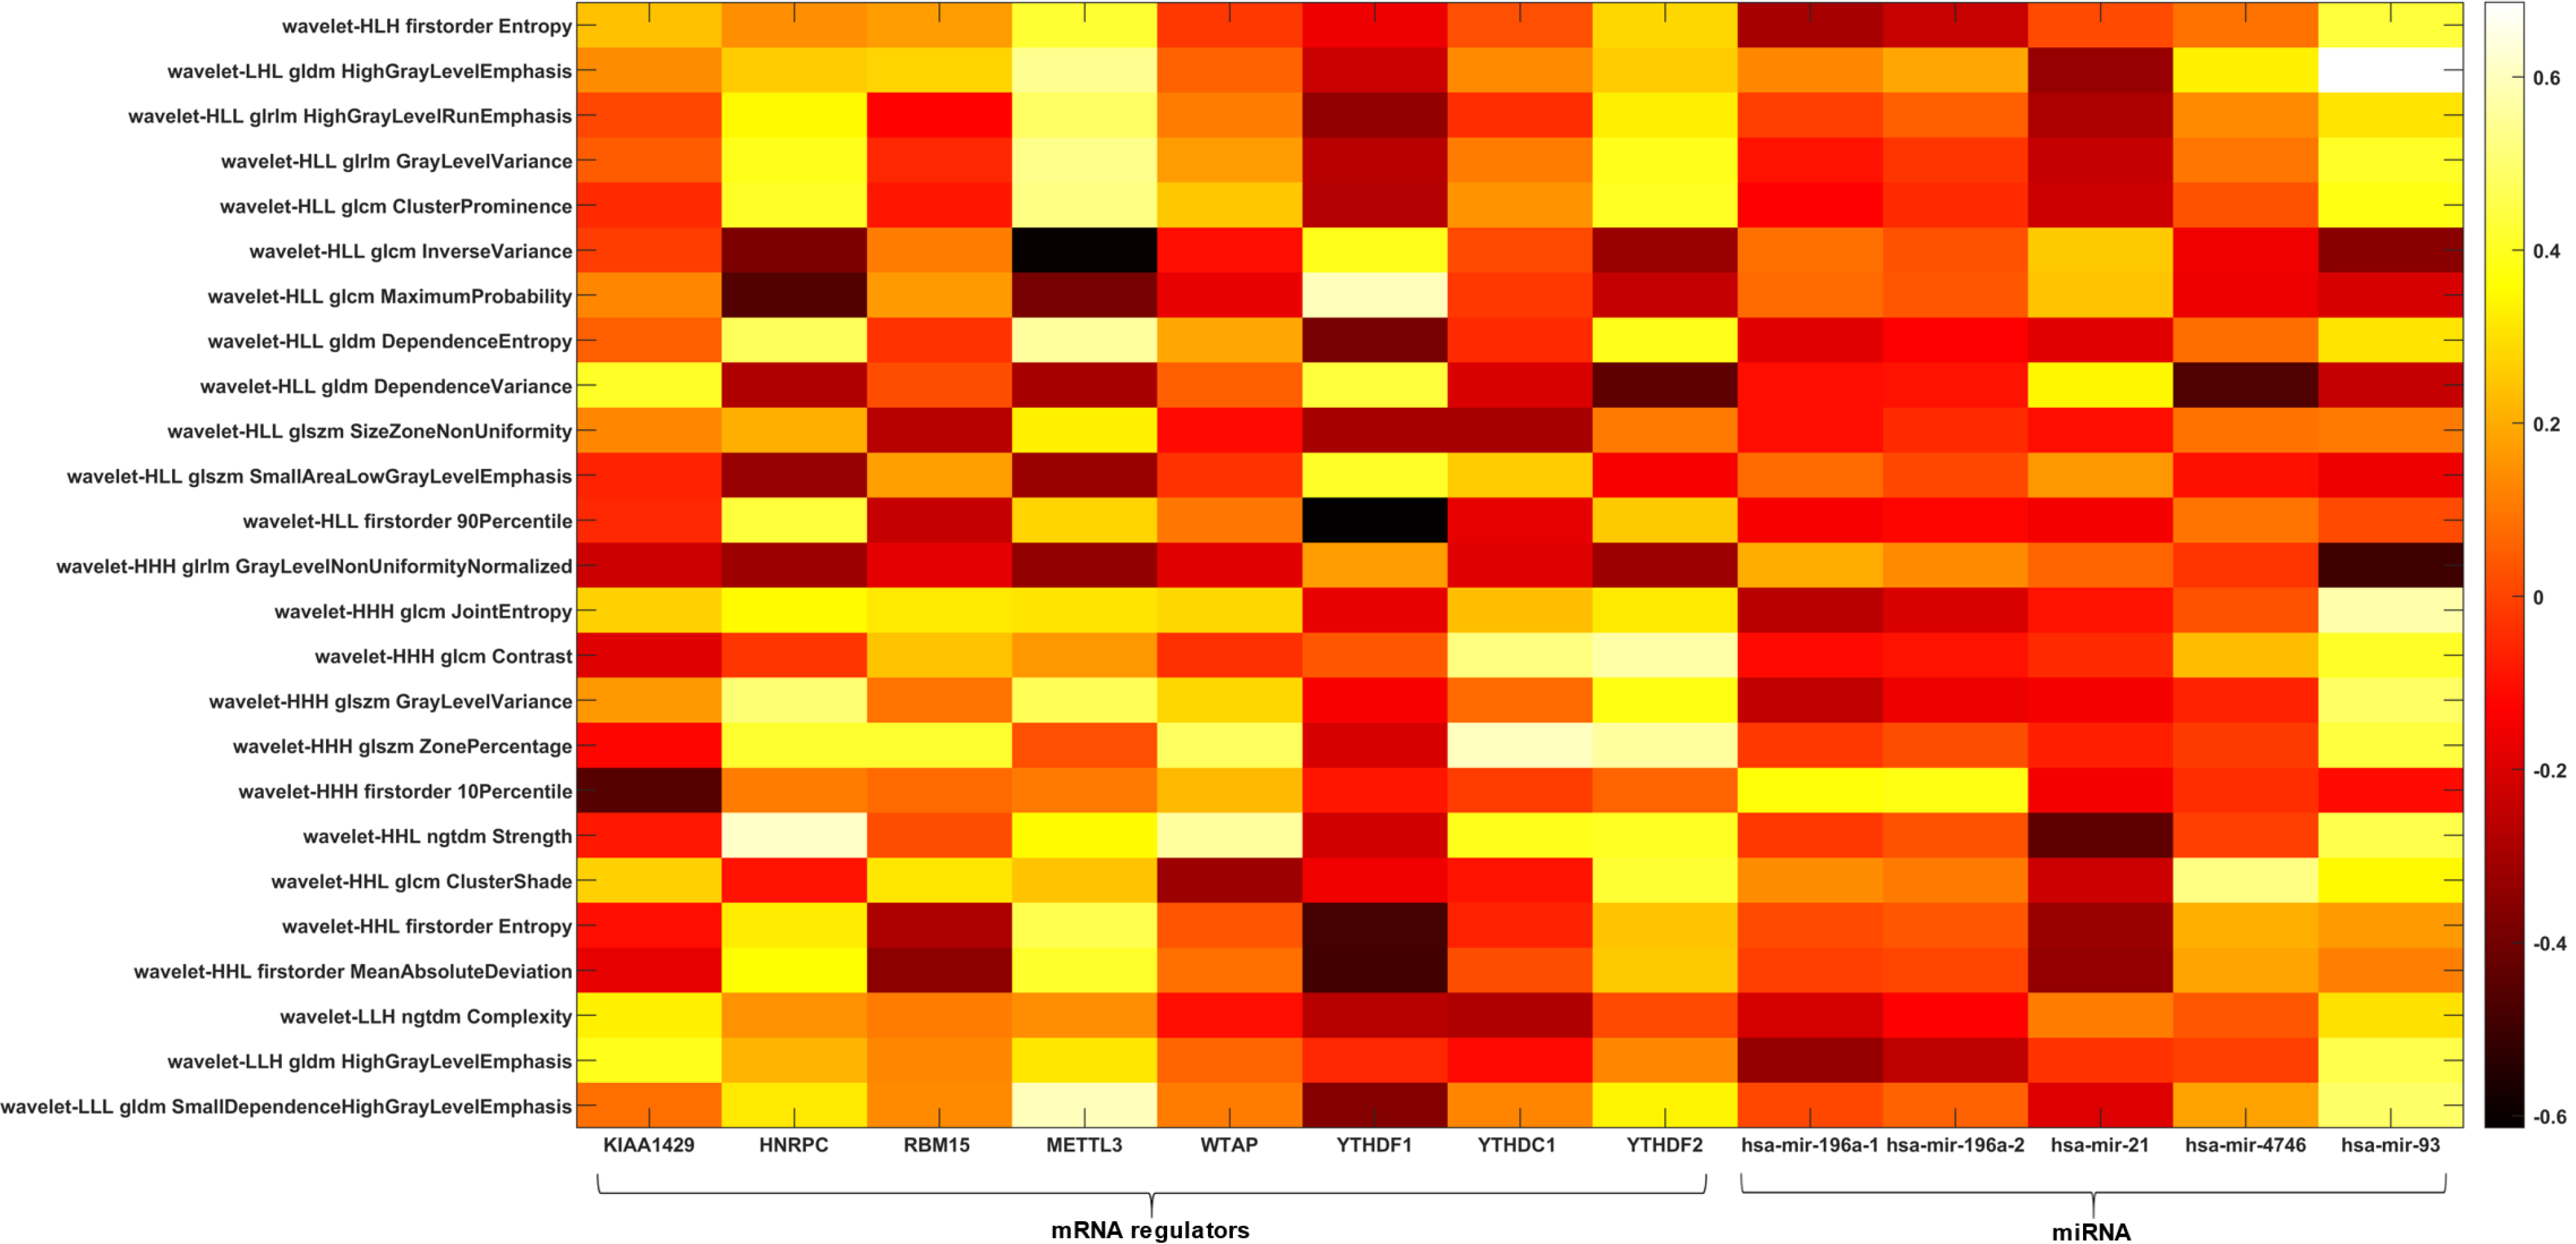
Figure 3 Radiogenomic analysis using stage as clinical outcome.
Heatmap depicting the correlation matrix between transcriptomic features and radiomic features significantly associated with stage. GLCM: Gray level co-occurrence matrix; GLDM: Gray level dependence matrix; GLRLM: Gray level run length matrix; GLSZM: Gray level size zone matrix; H: High-pass filter; L: Low-pass filter; NGTDM: Neighboring gray tone difference matrix.
- Citation: Brancato V, Garbino N, Mannelli L, Aiello M, Salvatore M, Franzese M, Cavaliere C. Impact of radiogenomics in esophageal cancer on clinical outcomes: A pilot study. World J Gastroenterol 2021; 27(36): 6110-6127
- URL: https://www.wjgnet.com/1007-9327/full/v27/i36/6110.htm
- DOI: https://dx.doi.org/10.3748/wjg.v27.i36.6110


