Copyright
©The Author(s) 2021.
World J Gastroenterol. Sep 21, 2021; 27(35): 5978-5988
Published online Sep 21, 2021. doi: 10.3748/wjg.v27.i35.5978
Published online Sep 21, 2021. doi: 10.3748/wjg.v27.i35.5978
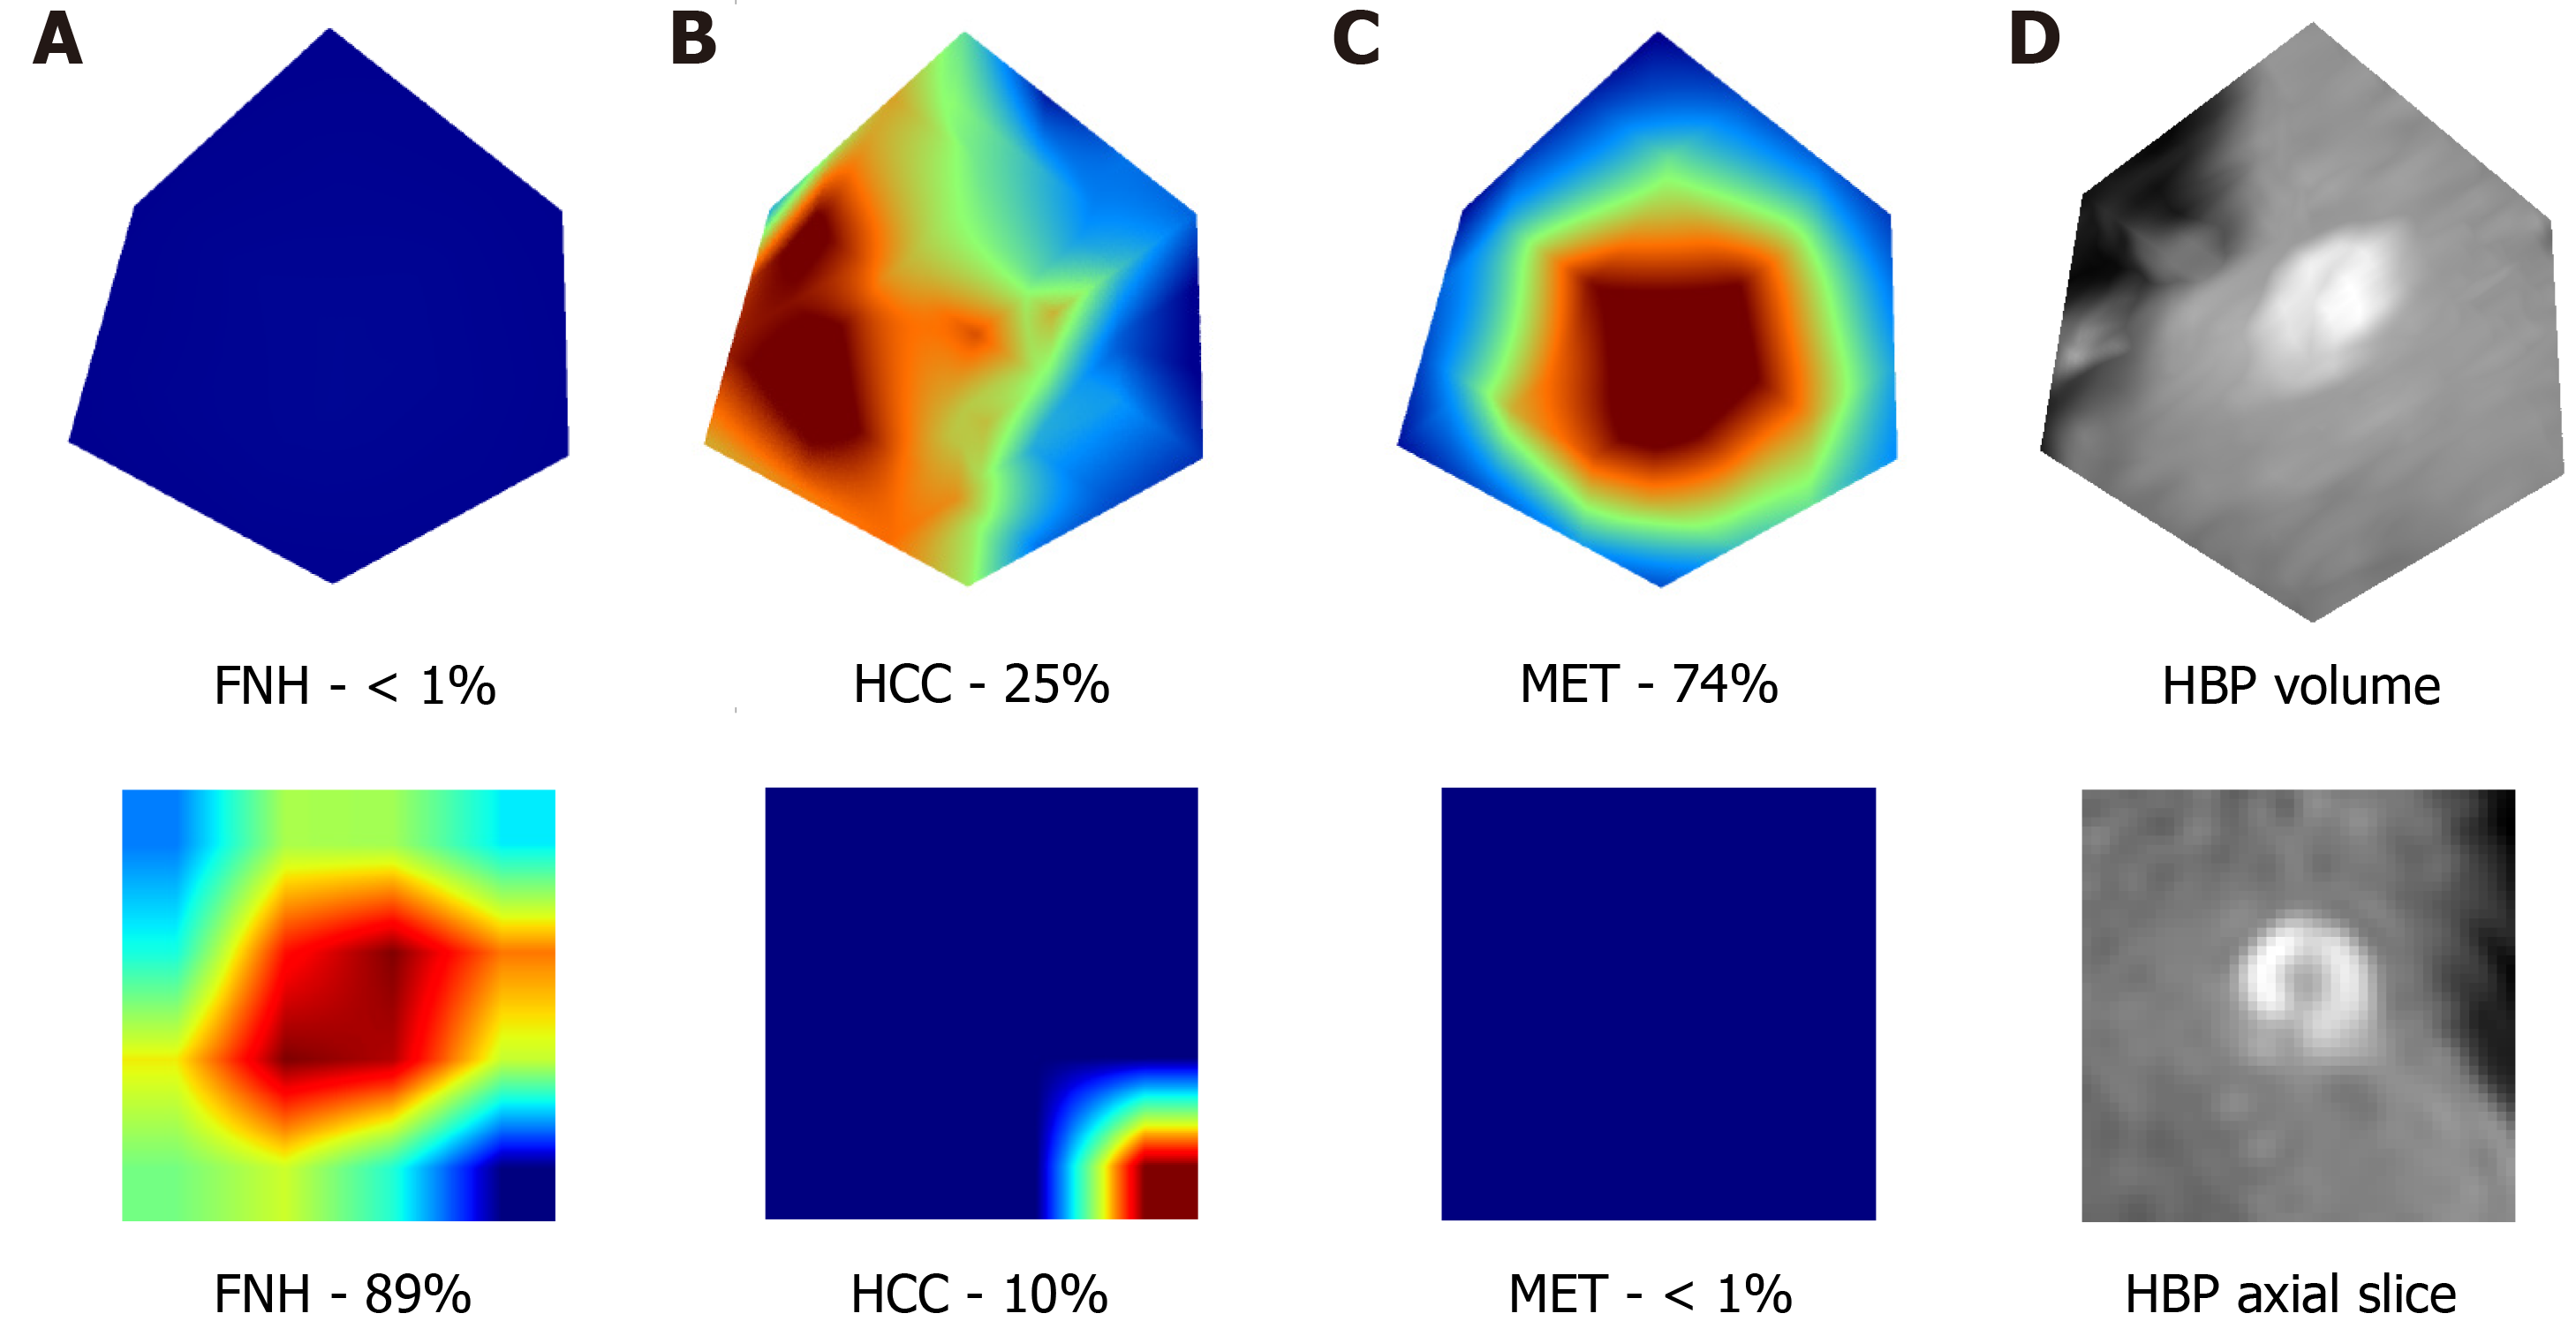
Figure 5 Visualization of the attention maps extracted from the two-dimensional and three-dimensional densely connected convolutional neural networks compared to the hepatobiliary phase input images.
Two-dimensional (lower row) and three-dimensional (upper row) attention maps (column A-C) and hepatobiliary phase (column D) images were extracted from the 3rd dense block of the trained network. A-C: Two-dimensional (lower row) and three-dimensional (upper row) attention maps; D: Hepatobiliary phase images. Column A contains the attention maps for focal nodular hyperplasia (FNH), column B for hepatocellular carcinoma, and column C for metastasis diagnosis. The correct diagnosis is FNH in this case. Probabilities for different lesion classes are annotated below each attention map. The red areas are more important for the classification than other image regions. FNH: Focal nodular hyperplasia; HCC: Hepatocellular carcinoma; MET: Metastasis; HBP: Hepatobiliary phase.
- Citation: Stollmayer R, Budai BK, Tóth A, Kalina I, Hartmann E, Szoldán P, Bérczi V, Maurovich-Horvat P, Kaposi PN. Diagnosis of focal liver lesions with deep learning-based multi-channel analysis of hepatocyte-specific contrast-enhanced magnetic resonance imaging. World J Gastroenterol 2021; 27(35): 5978-5988
- URL: https://www.wjgnet.com/1007-9327/full/v27/i35/5978.htm
- DOI: https://dx.doi.org/10.3748/wjg.v27.i35.5978


