Copyright
©The Author(s) 2021.
World J Gastroenterol. Sep 7, 2021; 27(33): 5575-5594
Published online Sep 7, 2021. doi: 10.3748/wjg.v27.i33.5575
Published online Sep 7, 2021. doi: 10.3748/wjg.v27.i33.5575
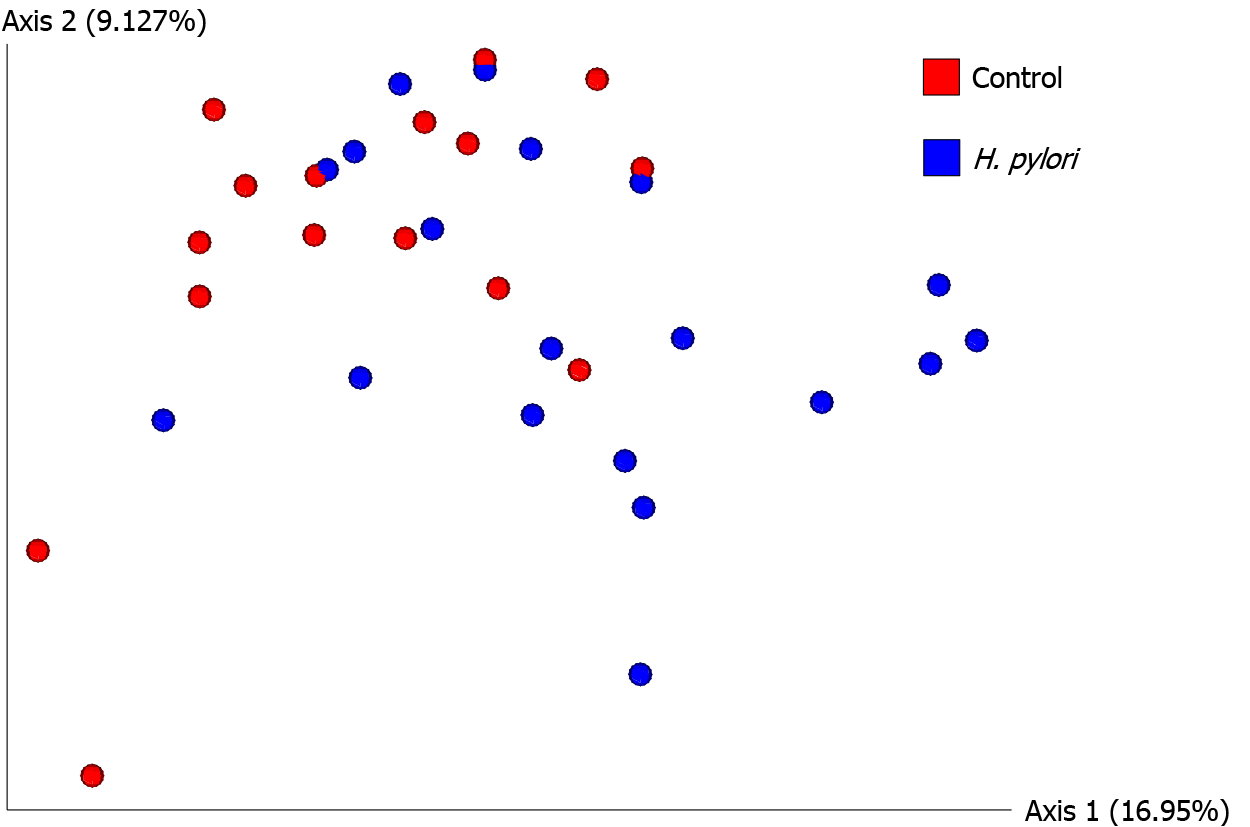
Figure 2 Beta diversity analysis by unweighted UniFrac principal coordinate analysis.
Unweighted principal coordinate analysis (PCoA) plot is shown comparing Helicobacter pylori (H. pylori) patients (blue, n = 19) to control subjects (red, n = 16). Significant differences between H. pylori patients and control subjects were identified by unweighted UniFrac PERMANOVA (F = 2.523, P = 0.001). The proportion of variance explained by each principal coordinate axis is denoted in the corresponding axis label; PCo1 explains 16.95% of the variability and PCo2 explains 9.13% of the variability. H. pylori: Helicobacter pylori.
- Citation: White B, Sterrett JD, Grigoryan Z, Lally L, Heinze JD, Alikhan H, Lowry CA, Perez LJ, DeSipio J, Phadtare S. Characterization of gut microbiome and metabolome in Helicobacter pylori patients in an underprivileged community in the United States. World J Gastroenterol 2021; 27(33): 5575-5594
- URL: https://www.wjgnet.com/1007-9327/full/v27/i33/5575.htm
- DOI: https://dx.doi.org/10.3748/wjg.v27.i33.5575


