Copyright
©The Author(s) 2021.
World J Gastroenterol. Jul 28, 2021; 27(28): 4722-4737
Published online Jul 28, 2021. doi: 10.3748/wjg.v27.i28.4722
Published online Jul 28, 2021. doi: 10.3748/wjg.v27.i28.4722
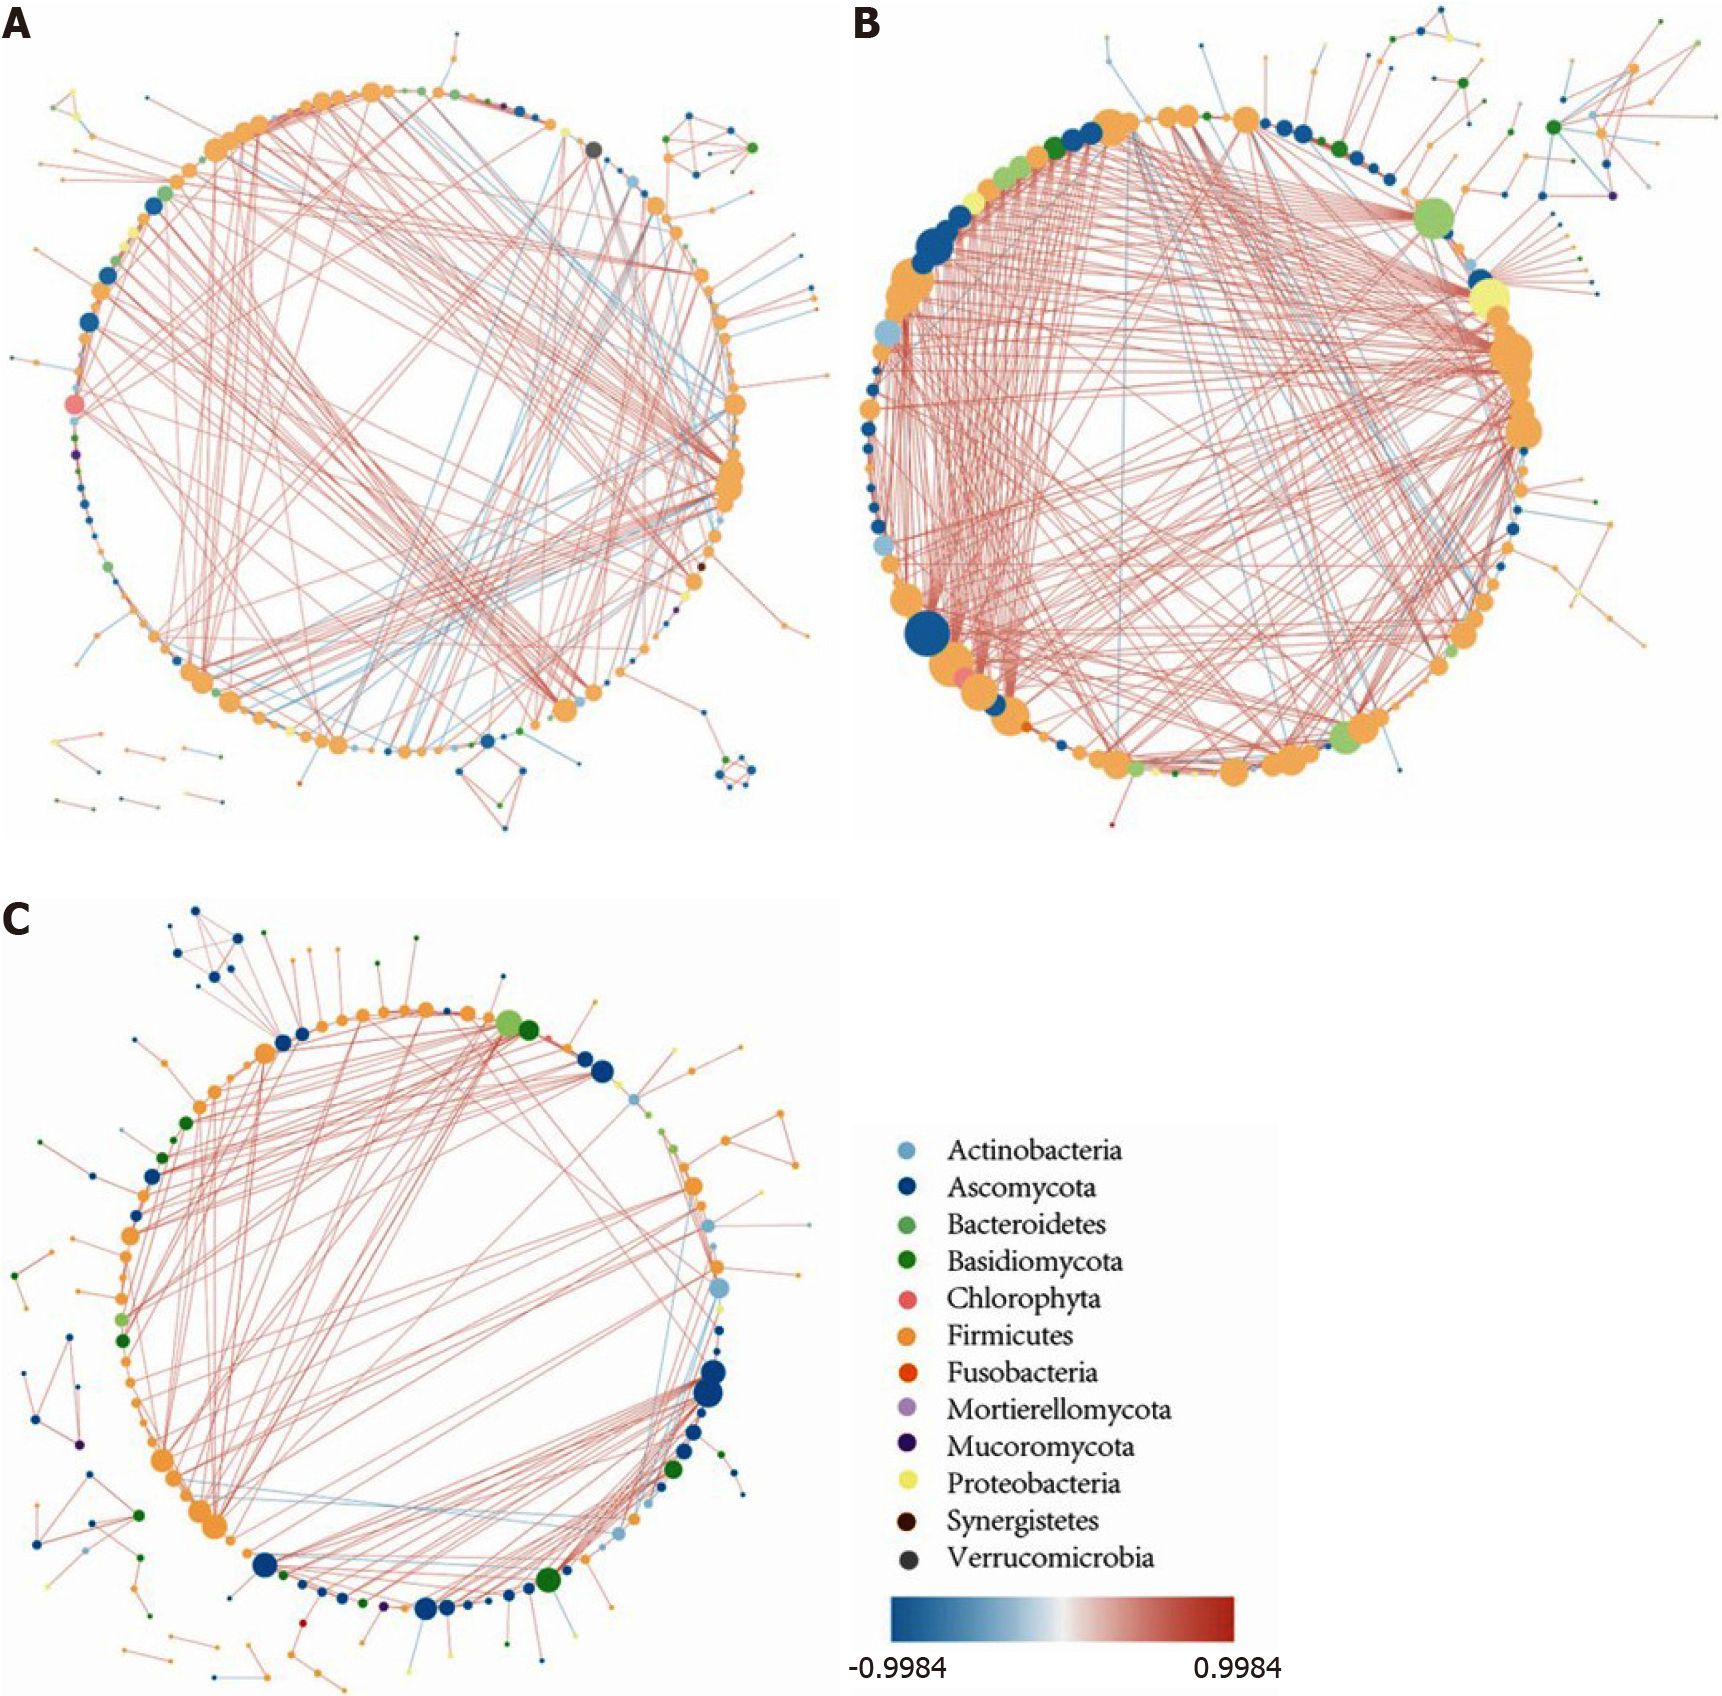
Figure 6 The intestinal microbiota correlation network.
A: The intestinal microbiota correlation network of non-inflammatory bowel disease controls; B: The intestinal microbiota correlation network of ulcerative colitis (UC) in remission; C: The intestinal microbiota correlation network of active UC. The network was constructed based on Spearman correlation coefficient analysis and the software Cytoscape v3.7.0., and only the significant correlations are shown (P < 0.05). Each node represents one microbial genus and its color represents the phylum that it belongs to. The size of the node is equal to the number of correlated pairs that it evolves. The depth of color of the line connecting two nodes reveals the strength of the association. The red color indicates positive correlations and the blue color indicates negative correlations. Compared with controls, the number of significant correlations increased in UC in remission but decreased in active UC. The most obvious change occurred in the number of bacteria-fungi correlations, while the number of fungi-fungi correlations was insignificant among the three groups.
- Citation: He XX, Li YH, Yan PG, Meng XC, Chen CY, Li KM, Li JN. Relationship between clinical features and intestinal microbiota in Chinese patients with ulcerative colitis. World J Gastroenterol 2021; 27(28): 4722-4737
- URL: https://www.wjgnet.com/1007-9327/full/v27/i28/4722.htm
- DOI: https://dx.doi.org/10.3748/wjg.v27.i28.4722


