Copyright
©The Author(s) 2021.
World J Gastroenterol. Jul 28, 2021; 27(28): 4722-4737
Published online Jul 28, 2021. doi: 10.3748/wjg.v27.i28.4722
Published online Jul 28, 2021. doi: 10.3748/wjg.v27.i28.4722
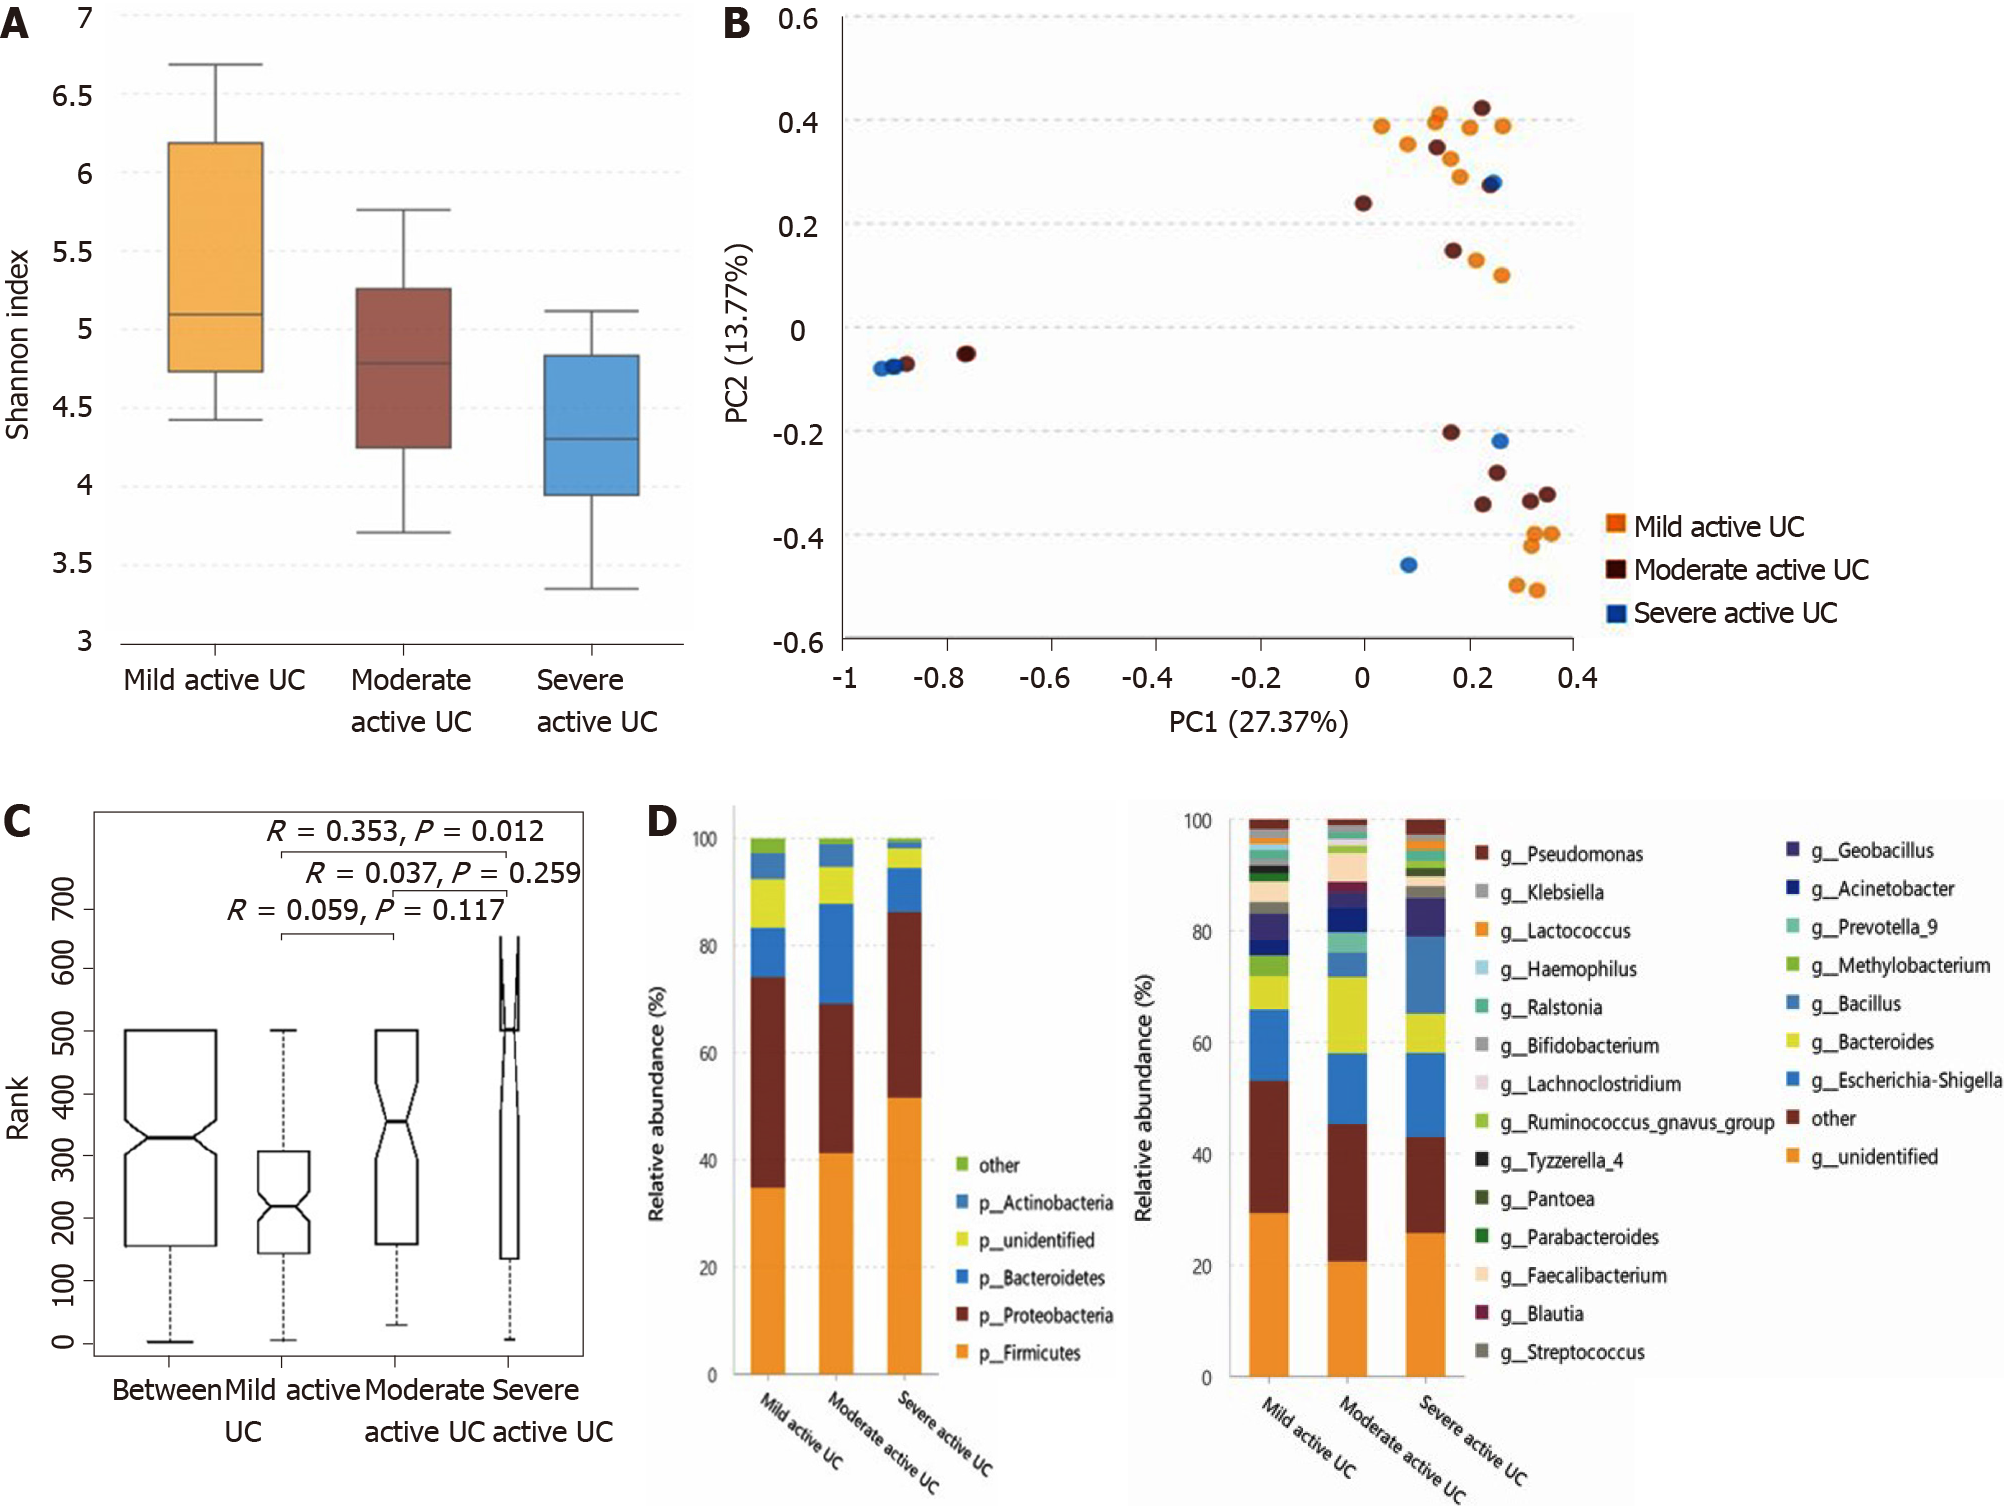
Figure 5 Statistical analysis of the sequencing results of the bacteria microbiota in mucosa samples from mild, moderate, and severe active ulcerative colitis groups.
A: The α-diversity of microbiota evaluated by Shannon index. The ordinate shows the Shannon index, and the abscissa shows the groups. The α-diversity of mucosal bacteria in severe active ulcerative colitis (UC) (Shannon index, 3.67 ± 1.25) was significantly lower than that of mild active UC (Shannon index, 5.40 ± 1.01; P = 0.017). Little difference was observed between the mild and moderate groups (Shannon index 4.80 ± 0.90; P = 0.100), neither between the moderate and severe ones (P = 0.251); B: Principal component analysis. The flora structure of mild and severe subgroups showed a significant difference (with a PC1 of 27.37% and a PC2 of 13.77%, as showed in the abscissa and ordinate axis separately); C: The analysis of similarities. The intergroup difference between mild and severe groups was significant (P = 0.012); D: The relative abundance of the bacteria at the phylum (the left bar graph) and genus (the right bar graph) levels. The ordinate shows the relative abundance (%), and the abscissa axis shows the sample types where the microbiota was sequenced from. At the phylum level, the relative abundance of Actinobacteria of severe active UC was significantly lower than that of mild/moderate UC, and fewer unidentified bacteria phyla were observed in severe UC than in mild UC. At the genus level, the relative abundance of Methylobacterium in mild UC was significantly higher than that in moderate/severe UC, and Blautia significantly decreased in severe UC compared with the other two groups. UC: Ulcerative colitis.
- Citation: He XX, Li YH, Yan PG, Meng XC, Chen CY, Li KM, Li JN. Relationship between clinical features and intestinal microbiota in Chinese patients with ulcerative colitis. World J Gastroenterol 2021; 27(28): 4722-4737
- URL: https://www.wjgnet.com/1007-9327/full/v27/i28/4722.htm
- DOI: https://dx.doi.org/10.3748/wjg.v27.i28.4722


