Copyright
©The Author(s) 2021.
World J Gastroenterol. Jul 28, 2021; 27(28): 4667-4686
Published online Jul 28, 2021. doi: 10.3748/wjg.v27.i28.4667
Published online Jul 28, 2021. doi: 10.3748/wjg.v27.i28.4667
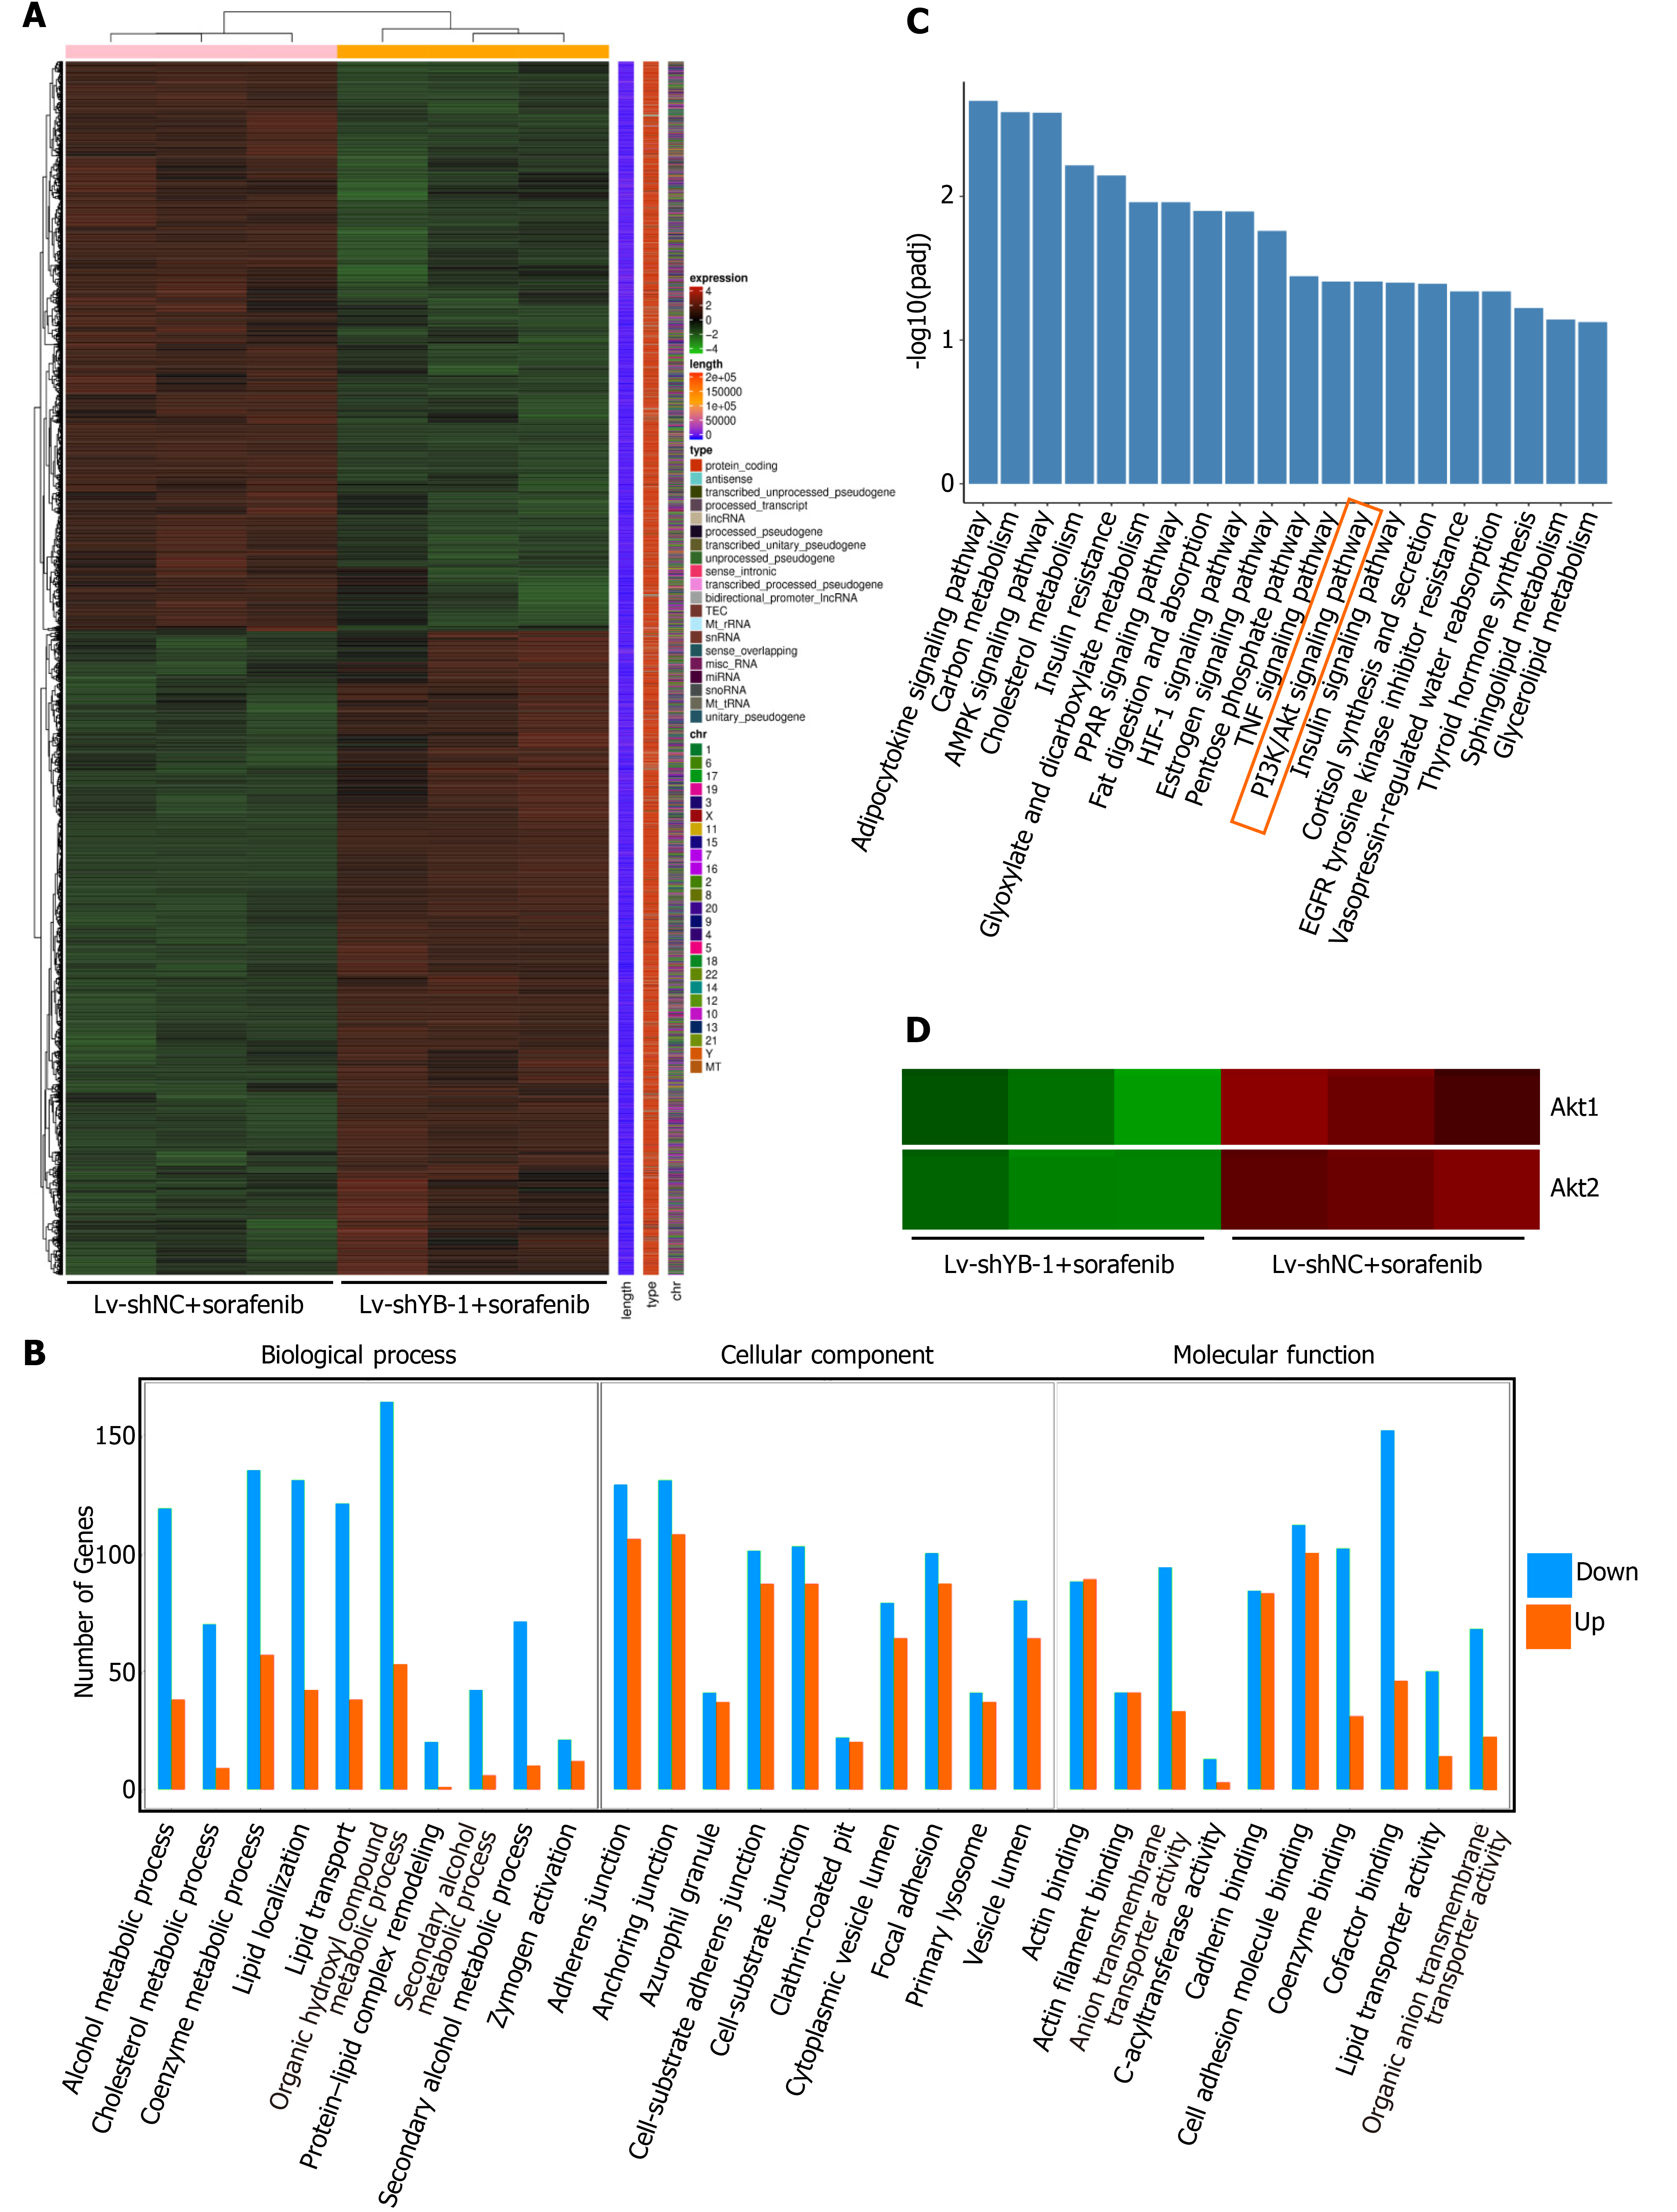
Figure 6 Digital gene expression profiling-seq analysis in HepG2 cells.
A: Heat map of the results from the cluster analysis of the digital gene expression profiling (DGE)-seq data (cells infected with: lentivirus encoding non-specific short hairpin RNA as a negative control (Lv-shNC) + sorafenib vs lentivirus encoding short hairpin RNA against Y box protein 1 (Lv-shYB-1) + sorafenib). Each column denotes the DEGs identified in our study. Each row indicates a sample. For each gene, red represents a high level of expression relative to the mean, while green expresses a low level. The scale bar is the number of standard deviations from the mean; B: Histogram of GO functional analysis for the DEGs obtained from DGE sequencing. GO terms with padj < 0.05 were thought to be notably enriched by DEGs. The y axis represents the number of genes in a GO classification category. Red represents increased expression in the Lv-shYB-1 + sorafenib group, whereas green indicates decreased expression in that group; C: Pathway enrichment analysis showed the top 20 signaling pathways in KEGG (padj < 0.05); D: mRNA expression levels of protein kinase B1 (Akt1) and protein kinase B2 (Akt2) from the DGE-seq data (Lv-shNC + sorafenib, Lv-shYB-1 + sorafenib).
- Citation: Liu T, Xie XL, Zhou X, Chen SX, Wang YJ, Shi LP, Chen SJ, Wang YJ, Wang SL, Zhang JN, Dou SY, Jiang XY, Cui RL, Jiang HQ. Y-box binding protein 1 augments sorafenib resistance via the PI3K/Akt signaling pathway in hepatocellular carcinoma. World J Gastroenterol 2021; 27(28): 4667-4686
- URL: https://www.wjgnet.com/1007-9327/full/v27/i28/4667.htm
- DOI: https://dx.doi.org/10.3748/wjg.v27.i28.4667


