Copyright
©The Author(s) 2021.
World J Gastroenterol. Jul 28, 2021; 27(28): 4653-4666
Published online Jul 28, 2021. doi: 10.3748/wjg.v27.i28.4653
Published online Jul 28, 2021. doi: 10.3748/wjg.v27.i28.4653
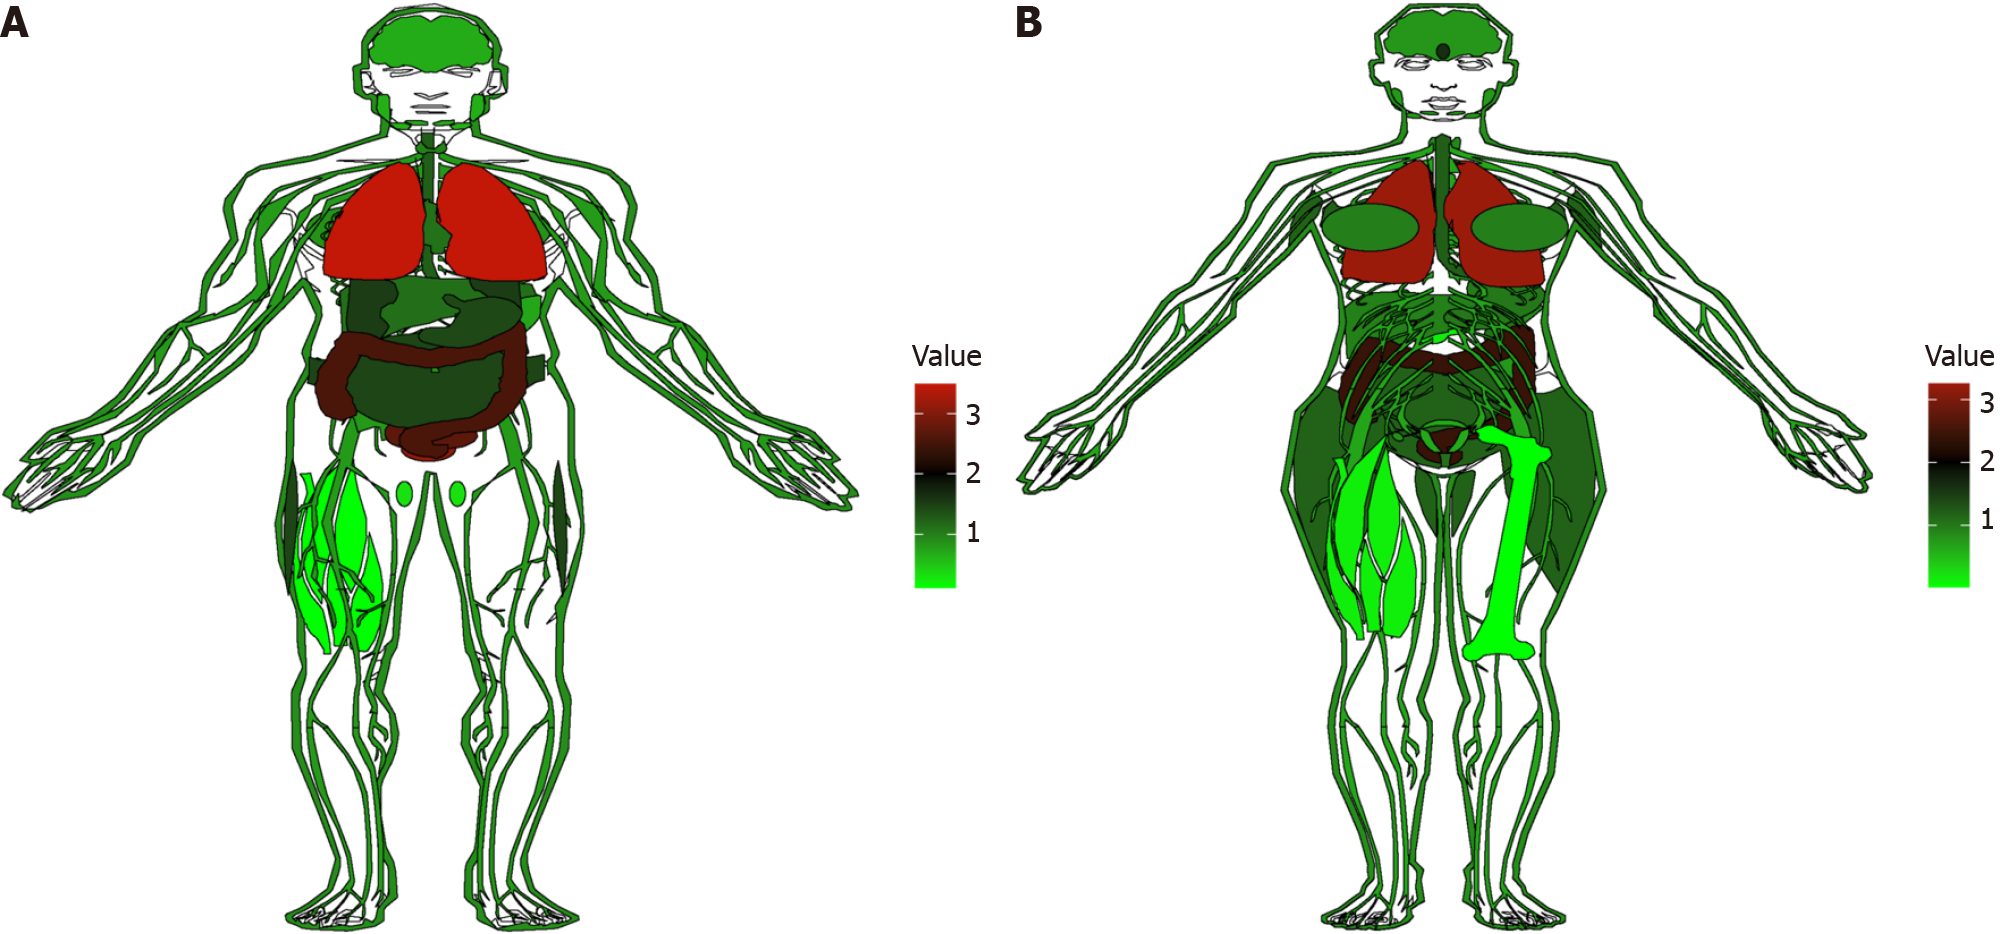
Figure 1 Visualization of cyclooxygenase-2 expression in normal tissues from the genotypic tissue expression database.
The red parts indicate the organs with more cyclooxygenase-2 distribution, while the green parts indicate less distribution. A: Distribution of expression in males; B: Distribution of expression in females.
- Citation: Ji XK, Madhurapantula SV, He G, Wang KY, Song CH, Zhang JY, Wang KJ. Genetic variant of cyclooxygenase-2 in gastric cancer: More inflammation and susceptibility. World J Gastroenterol 2021; 27(28): 4653-4666
- URL: https://www.wjgnet.com/1007-9327/full/v27/i28/4653.htm
- DOI: https://dx.doi.org/10.3748/wjg.v27.i28.4653


