Copyright
©The Author(s) 2021.
World J Gastroenterol. Jun 14, 2021; 27(22): 3097-3108
Published online Jun 14, 2021. doi: 10.3748/wjg.v27.i22.3097
Published online Jun 14, 2021. doi: 10.3748/wjg.v27.i22.3097
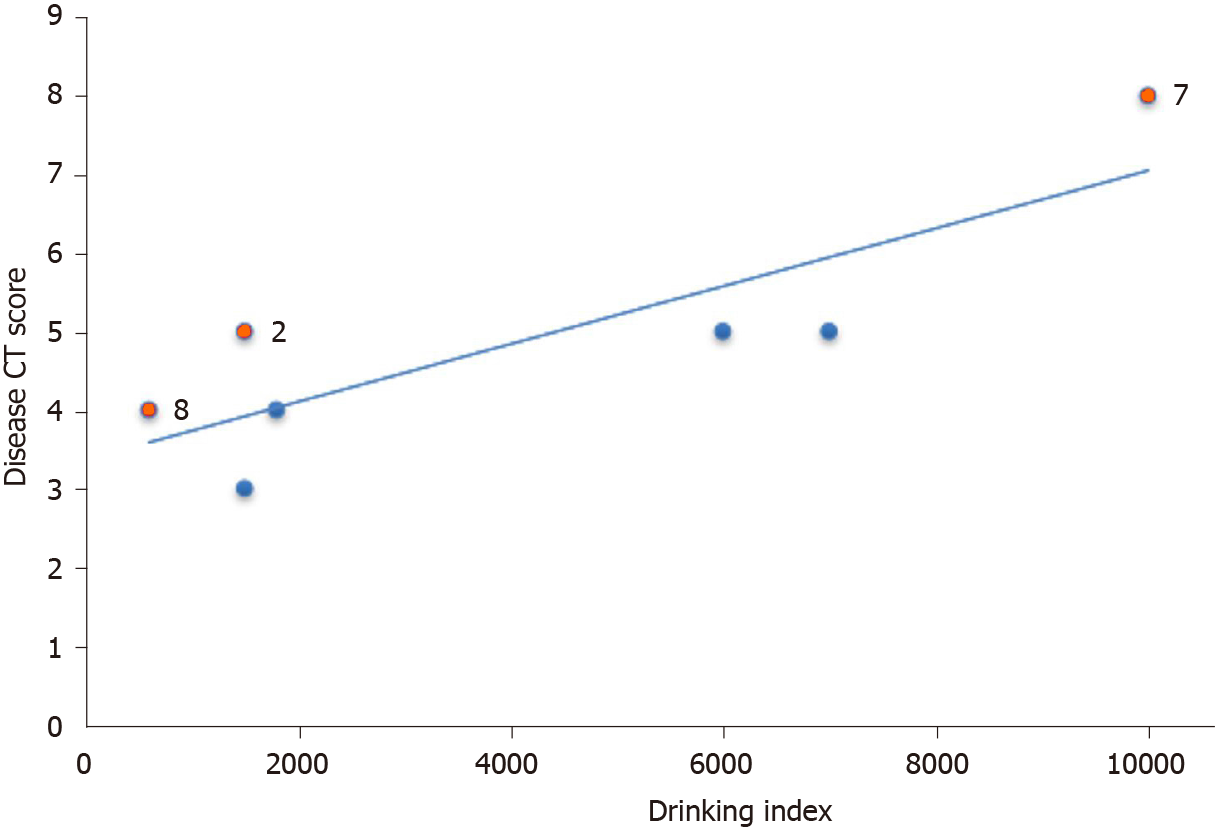
Figure 4 Dispersion diagram and best fitting line for the drinking index vs the disease computed tomography score.
Patients two, seven, and eight had histories of diabetes, chronic nephritis, or prostate cancer are shown by red dots. CT: Computed tomography.
- Citation: Wen Y, Chen YW, Meng AH, Zhao M, Fang SH, Ma YQ. Idiopathic mesenteric phlebosclerosis associated with long-term oral intake of geniposide. World J Gastroenterol 2021; 27(22): 3097-3108
- URL: https://www.wjgnet.com/1007-9327/full/v27/i22/3097.htm
- DOI: https://dx.doi.org/10.3748/wjg.v27.i22.3097


