Copyright
©The Author(s) 2021.
World J Gastroenterol. Jan 14, 2021; 27(2): 189-207
Published online Jan 14, 2021. doi: 10.3748/wjg.v27.i2.189
Published online Jan 14, 2021. doi: 10.3748/wjg.v27.i2.189
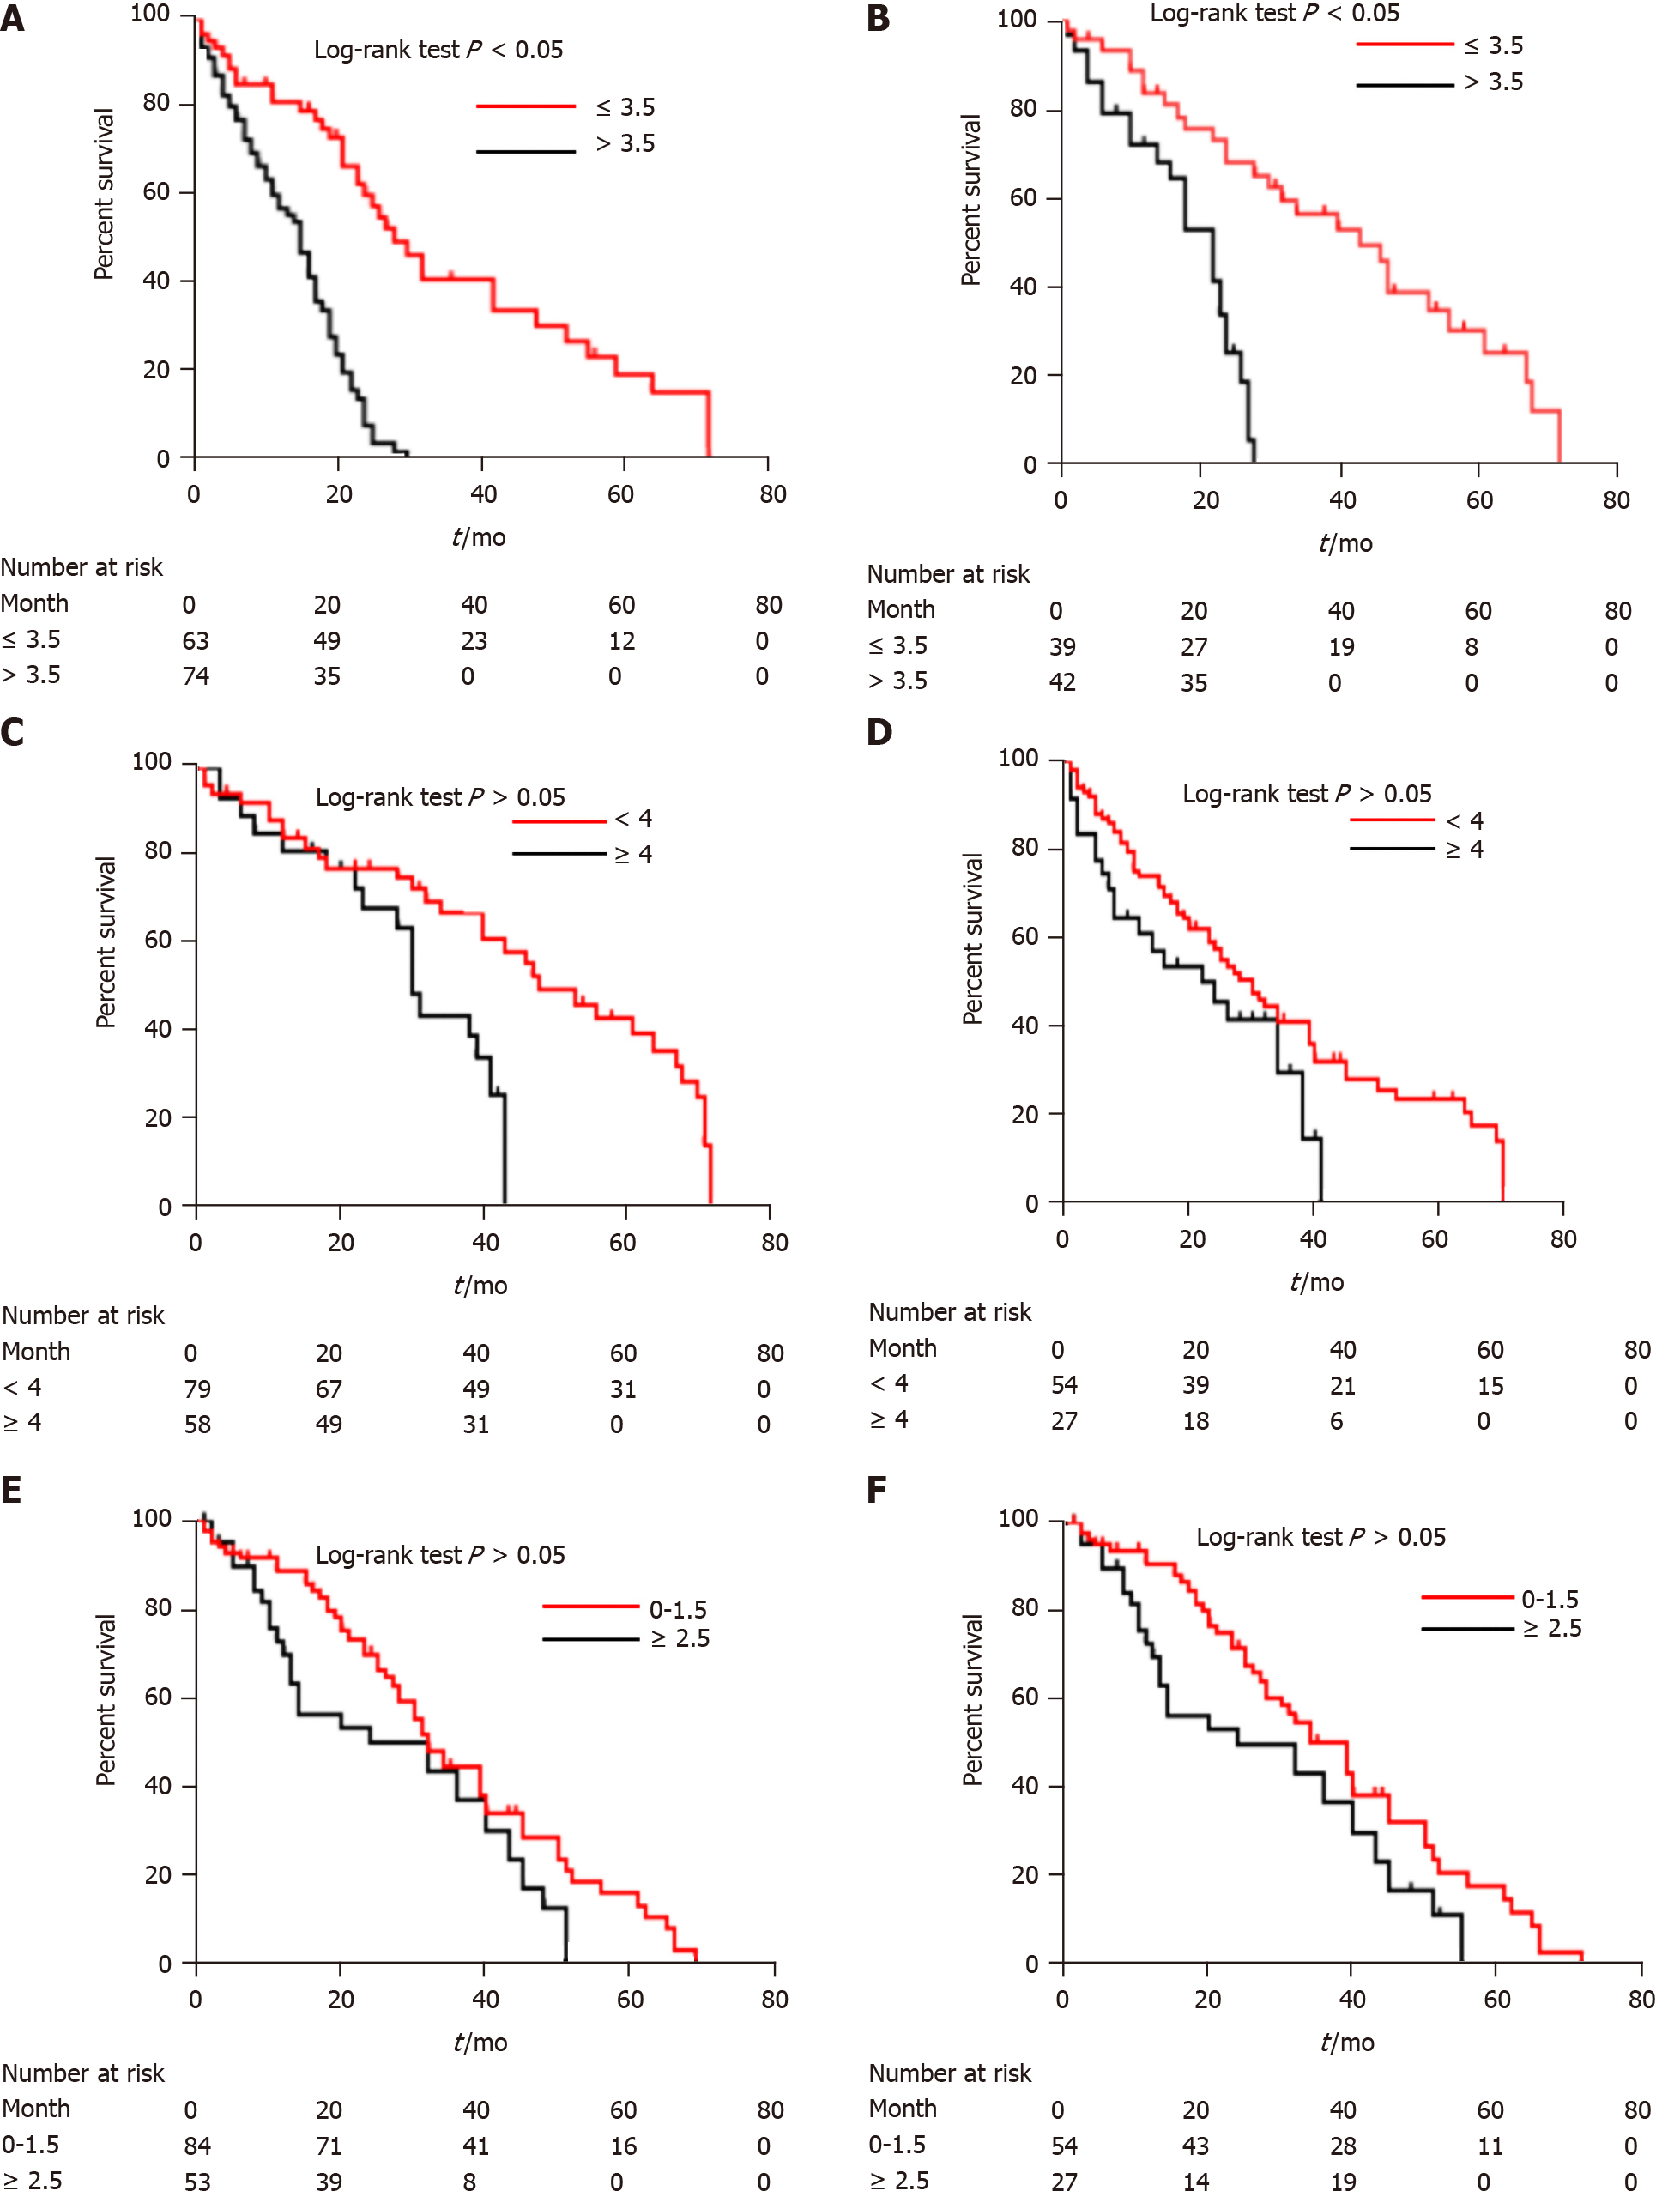
Figure 6 Kaplan-Meier curves of survival outcomes in different patient groups.
A: Kaplan-Meier analysis of overall survival of high-risk (> 3.5) and low-risk (≤ 3.5) patients according to computed tomography (CT)-based radiomics nomogram in the training cohort; B: Kaplan-Meier analysis of overall survival of high-risk (> 3.5) and low-risk (≤ 3.5) patients according to CT-based radiomics nomogram in the validation cohort; C: Kaplan-Meier analysis of overall survival of high-risk (≥ 4) and low-risk (< 4) patients according to α-fetoprotein, Barcelona Clinic Liver Cancer, Child-Pugh, and Response (ABCR) score in the training cohort; D: Kaplan-Meier analysis of overall survival of high-risk (≥ 4) and low-risk (< 4) patients according to ABCR score in the validation cohort; E: Kaplan-Meier analysis of overall survival of high-risk (≥ 2.5) and low-risk (0-1.5) patients according to Assessment for Retreatment with Transarterial Chemoembolization (ART) score in the training cohort; F: Kaplan-Meier analysis of overall survival of high-risk (≥ 2.5) and low-risk (0-1.5) patients according to ART score in the validation cohort.
- Citation: Niu XK, He XF. Development of a computed tomography-based radiomics nomogram for prediction of transarterial chemoembolization refractoriness in hepatocellular carcinoma. World J Gastroenterol 2021; 27(2): 189-207
- URL: https://www.wjgnet.com/1007-9327/full/v27/i2/189.htm
- DOI: https://dx.doi.org/10.3748/wjg.v27.i2.189


