Copyright
©The Author(s) 2021.
World J Gastroenterol. Jan 14, 2021; 27(2): 189-207
Published online Jan 14, 2021. doi: 10.3748/wjg.v27.i2.189
Published online Jan 14, 2021. doi: 10.3748/wjg.v27.i2.189
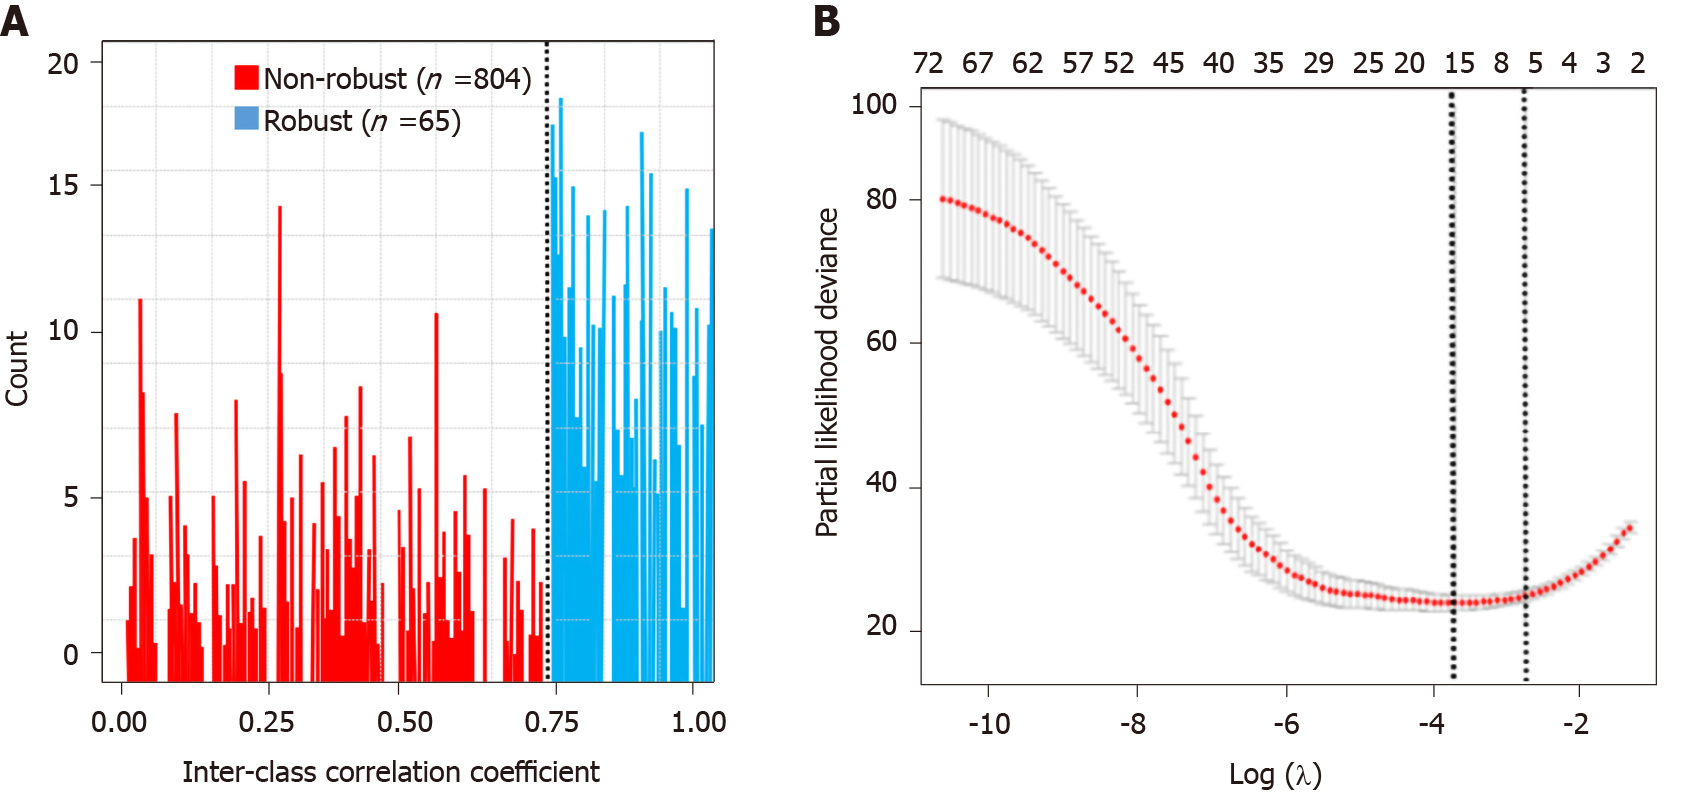
Figure 3 Feature selection.
A: Histogram of the inter-class correlation coefficient. The intraclass correlation coefficient (ICC) was used to determine the stability of the features. Features with an ICC < 0.8 were excluded from the analysis. After robustness test, 65 of the initial 869 computed tomography image features in the arterial phase were retained; B: Partial likelihood deviance was drawn vs log (λ) in the arterial phase.
- Citation: Niu XK, He XF. Development of a computed tomography-based radiomics nomogram for prediction of transarterial chemoembolization refractoriness in hepatocellular carcinoma. World J Gastroenterol 2021; 27(2): 189-207
- URL: https://www.wjgnet.com/1007-9327/full/v27/i2/189.htm
- DOI: https://dx.doi.org/10.3748/wjg.v27.i2.189


