Copyright
©The Author(s) 2021.
World J Gastroenterol. Jan 14, 2021; 27(2): 152-161
Published online Jan 14, 2021. doi: 10.3748/wjg.v27.i2.152
Published online Jan 14, 2021. doi: 10.3748/wjg.v27.i2.152
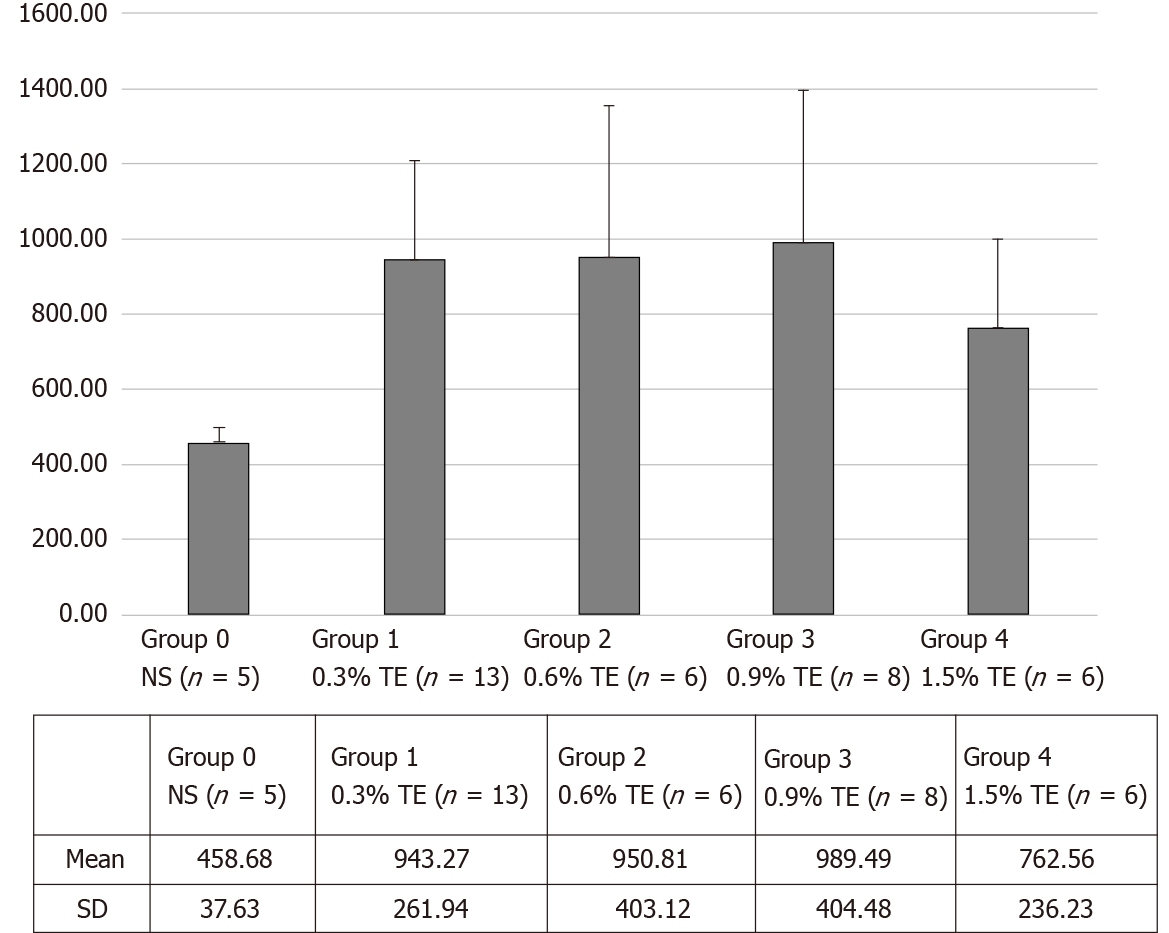
Figure 3 Longitudinal plot of mean doxorubicin concentration in the liver in the control and triolein emulsion groups.
NS: Normal saline; TE: Triolein emulsion.
- Citation: Kim YW, Kim HJ, Cho BM, Choi SH. Triolein emulsion infusion into the hepatic artery increases vascular permeability to doxorubicin in rabbit liver. World J Gastroenterol 2021; 27(2): 152-161
- URL: https://www.wjgnet.com/1007-9327/full/v27/i2/152.htm
- DOI: https://dx.doi.org/10.3748/wjg.v27.i2.152


