Copyright
©The Author(s) 2021.
World J Gastroenterol. May 21, 2021; 27(19): 2376-2393
Published online May 21, 2021. doi: 10.3748/wjg.v27.i19.2376
Published online May 21, 2021. doi: 10.3748/wjg.v27.i19.2376
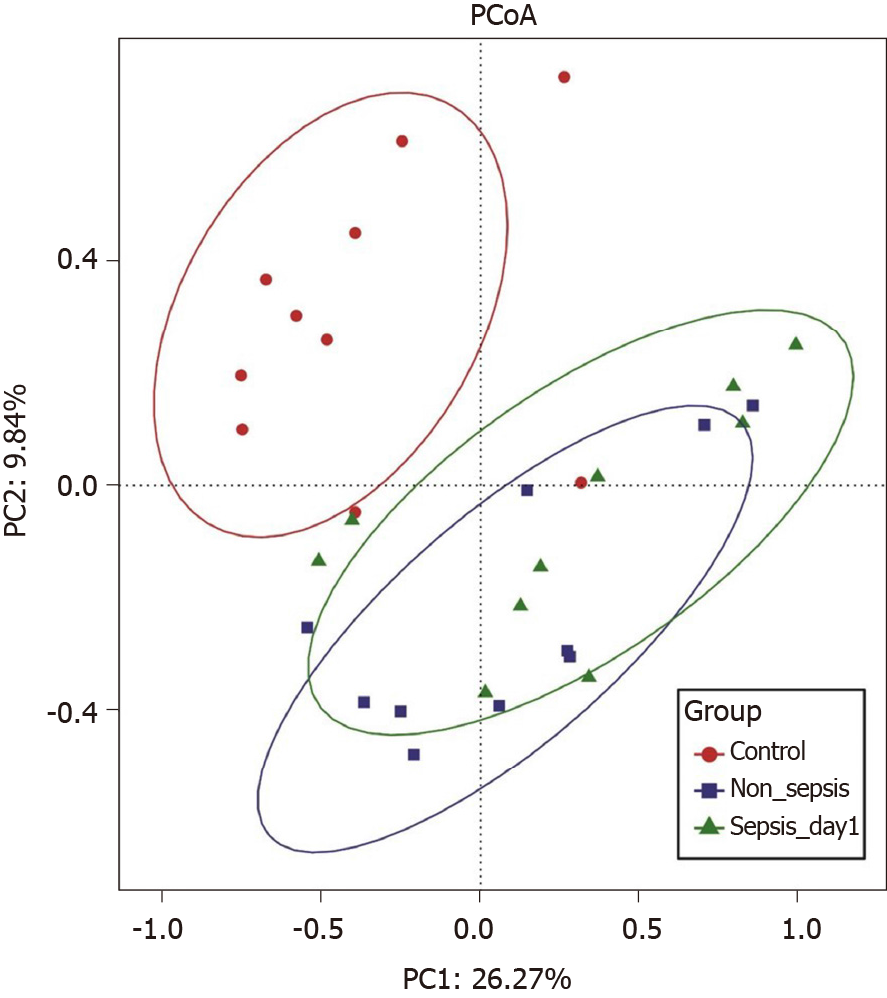
Figure 2 Principal coordinate analysis of intestinal flora among normal individuals, sepsis patients, and non-sepsis patients.
Principal coordinate analysis was plotted based on the Bray–Curtis dissimilarity between samples. The ellipses highlight the clustering of the fecal microbiomes according to groups (red: Healthy control group; blue: Non-sepsis group; green: Day 1 of sepsis).
- Citation: Yang XJ, Liu D, Ren HY, Zhang XY, Zhang J, Yang XJ. Effects of sepsis and its treatment measures on intestinal flora structure in critical care patients. World J Gastroenterol 2021; 27(19): 2376-2393
- URL: https://www.wjgnet.com/1007-9327/full/v27/i19/2376.htm
- DOI: https://dx.doi.org/10.3748/wjg.v27.i19.2376


