Copyright
©The Author(s) 2021.
World J Gastroenterol. Apr 28, 2021; 27(16): 1770-1784
Published online Apr 28, 2021. doi: 10.3748/wjg.v27.i16.1770
Published online Apr 28, 2021. doi: 10.3748/wjg.v27.i16.1770
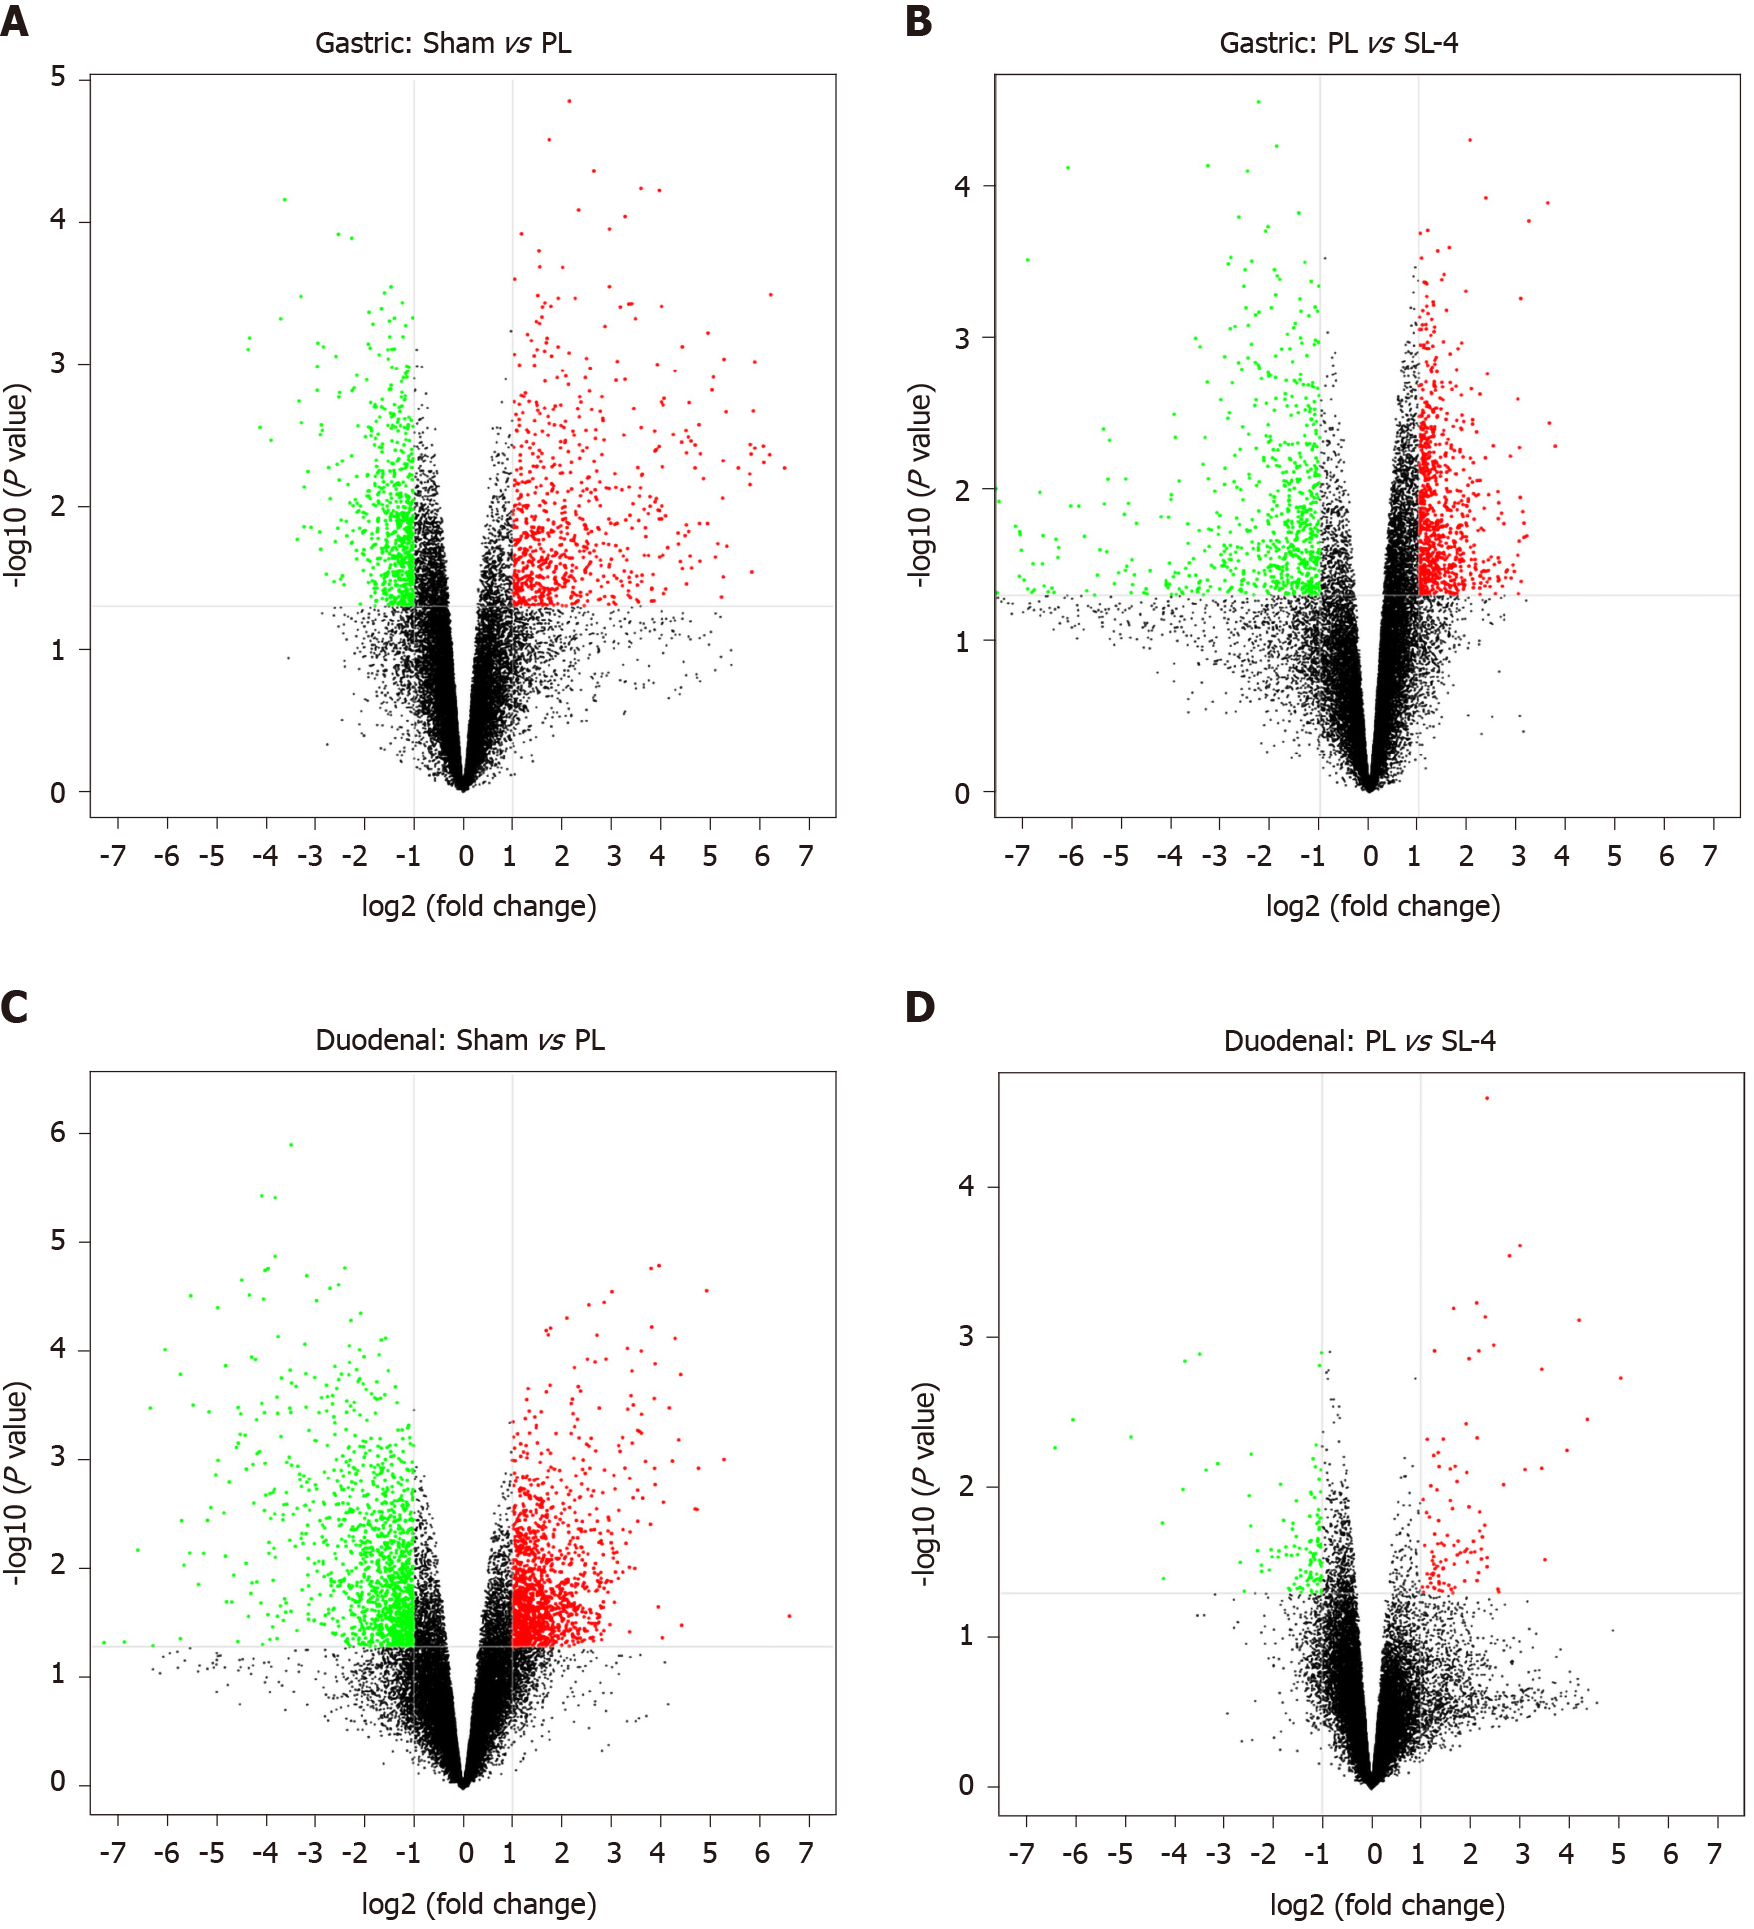
Figure 4 Volcano plots of microarray data on differentially expressed mRNA in gastric and duodenal tissue.
A and B: There were 1415 and 1460 differentially expressed genes in the sham operation vs pyloric ligation (PL) (A) and PL vs SL-4 groups (B), respectively in gastric tissue; C and D: There were 2610 and 209 differentially expressed genes in the sham operation vs PL (C) and PL vs SL-4 groups (D), respectively in duodenal tissue. Vertical lines correspond to 2-fold up- and downregulation. The horizontal line represents a P value of 0.05. Significantly up- and downregulated genes are shown in red and green, respectively. Statistical significance was defined as a fold-change of 2.0 and P value of 0.05 between groups. Sham: Sham operation, SL-4: Sulongga-4 decoction.
- Citation: Tong S, Wang H, A LS, Bai TN, Gong JH, Jin WJ, Dai LL, Ba GN, Cho SB, Fu MH. Protective effect and mechanisms of action of Mongolian medicine Sulongga-4 on pyloric ligation-induced gastroduodenal ulcer in rats. World J Gastroenterol 2021; 27(16): 1770-1784
- URL: https://www.wjgnet.com/1007-9327/full/v27/i16/1770.htm
- DOI: https://dx.doi.org/10.3748/wjg.v27.i16.1770


