Copyright
©The Author(s) 2021.
World J Gastroenterol. Mar 28, 2021; 27(12): 1161-1181
Published online Mar 28, 2021. doi: 10.3748/wjg.v27.i12.1161
Published online Mar 28, 2021. doi: 10.3748/wjg.v27.i12.1161
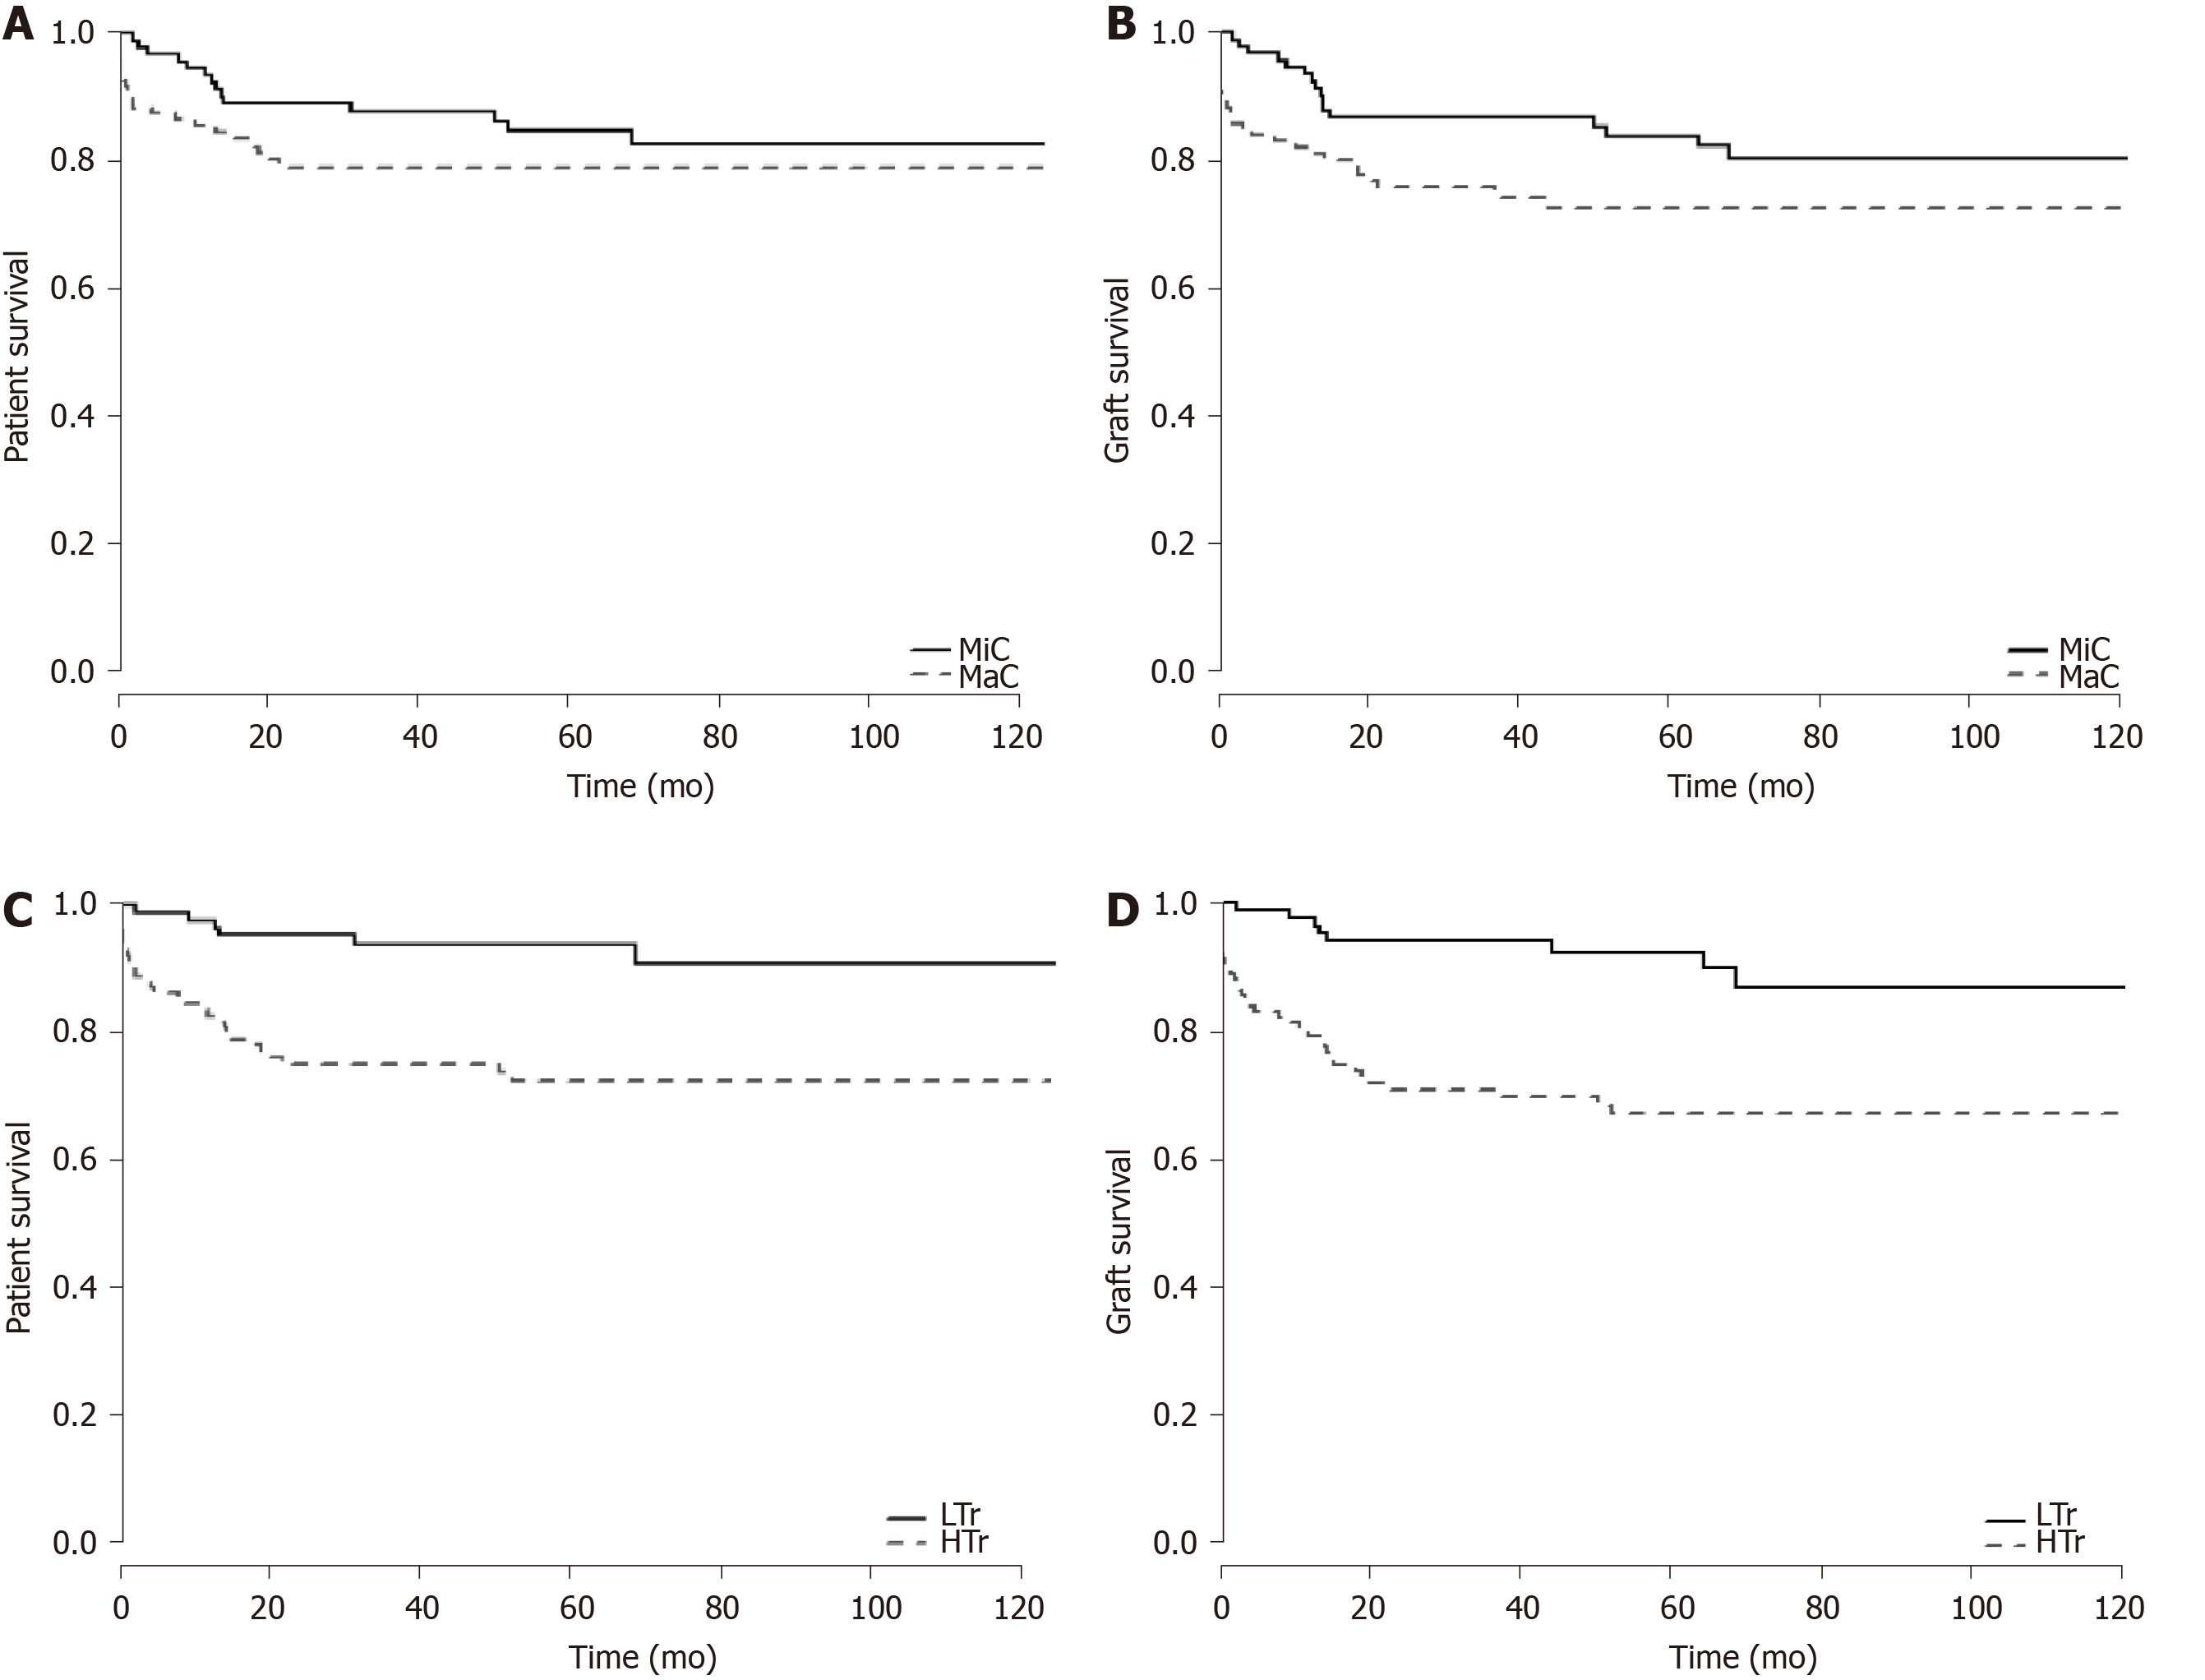
Figure 3 Patient and graft survival curves.
A: Patient survival analysis comparing the minor complication (MiC) group (grade I-IIIa, n = 109) and the major complication (MaC) group (grade IIIb-V, n = 131) with number of patients at risk. Log-rank test: Chi-square = 12.6, degrees of freedom (df) = 1, P = 0.12; B: Graft survival analysis comparing the MiC and MaC groups. Log-rank test: Chi-square = 14.6, df = 1, P = 0.03; C: Patient survival analysis comparing the low-volume transfusion (LTr) group (n = 103) and the high-volume transfusion (HTr) group (n = 137). Log-rank test: Chi-square = 12.6, df = 1, P < 0.001; D: Graft survival analysis comparing the LTr (n = 103) and HTr (n = 137) groups. Log-rank test: Chi-square = 14.6, df = 1, P < 0.001. MiC: Minor complications group (I-IIIa); MaC: Major complications group (IIIb-V); LTr: Low-volume transfusion group; HTr: High-volume transfusion group.
- Citation: Gordon K, Figueira ERR, Rocha-Filho JA, Mondadori LA, Joaquim EHG, Seda-Neto J, da Fonseca EA, Pugliese RPS, Vintimilla AM, Auler Jr JOC, Carmona MJC, D'Alburquerque LAC. Perioperative blood transfusion decreases long-term survival in pediatric living donor liver transplantation. World J Gastroenterol 2021; 27(12): 1161-1181
- URL: https://www.wjgnet.com/1007-9327/full/v27/i12/1161.htm
- DOI: https://dx.doi.org/10.3748/wjg.v27.i12.1161


