Copyright
©The Author(s) 2020.
World J Gastroenterol. Mar 7, 2020; 26(9): 904-917
Published online Mar 7, 2020. doi: 10.3748/wjg.v26.i9.904
Published online Mar 7, 2020. doi: 10.3748/wjg.v26.i9.904
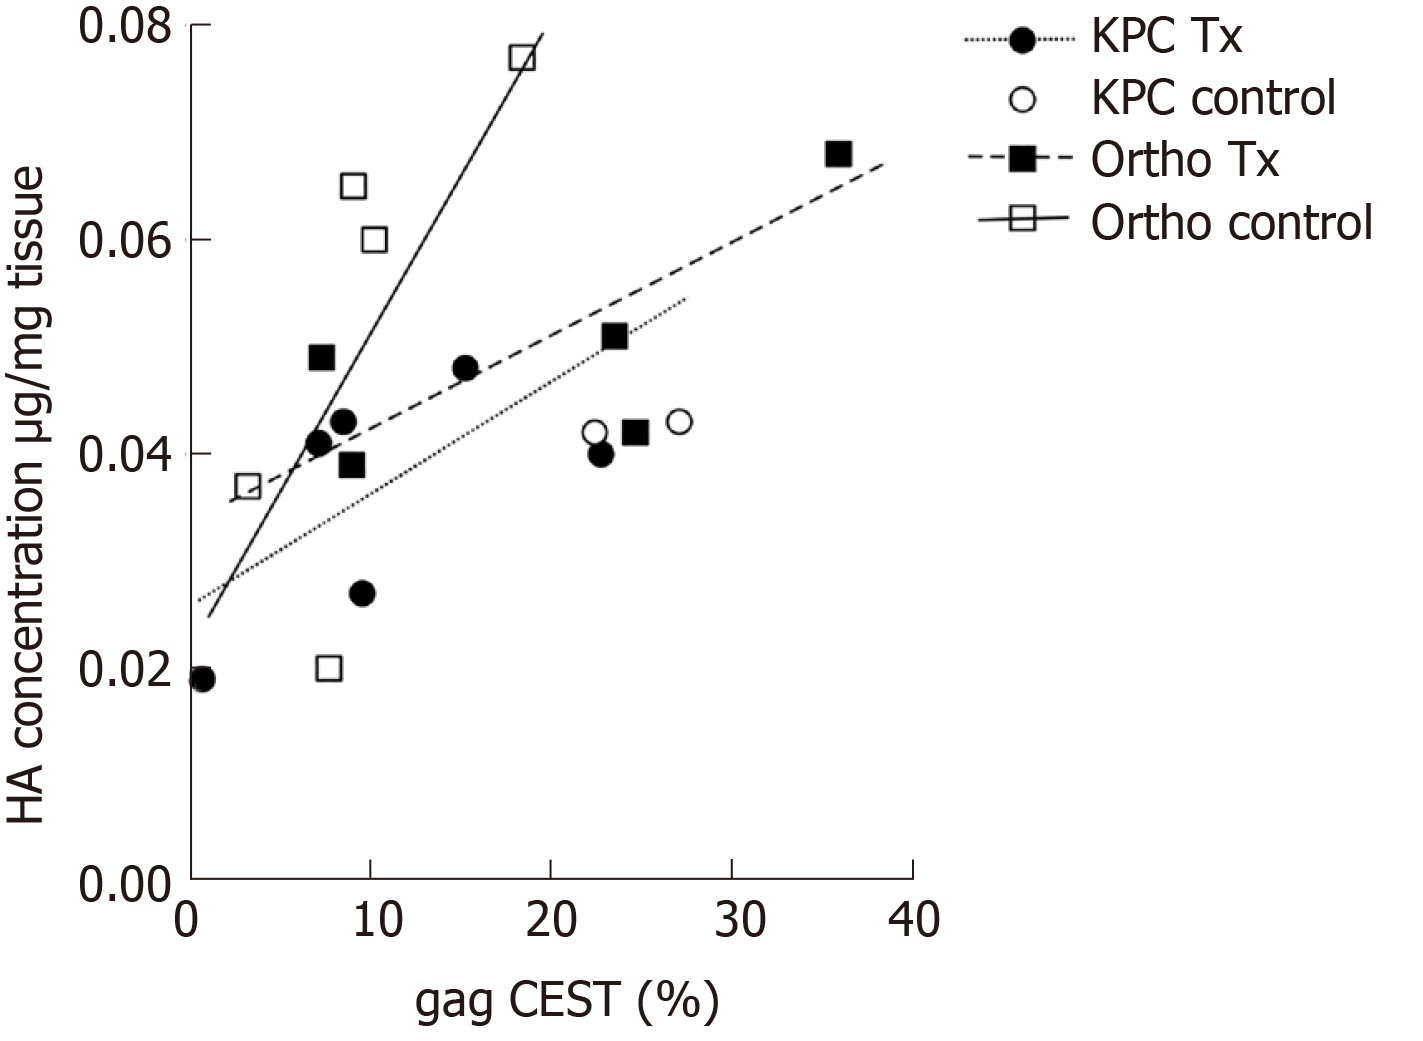
Figure 4 Total hyaluronic acid concentration compared to glycosaminoglycan chemical exchange saturation transfer for treated and sham treated (control) KPC and orthotopic mice.
Regression lines for each animal model and condition demonstrate strong positive correlation between the hyaluronic acid concentrations as determined by the biochemical assay and glycosaminoglycan chemical exchange saturation transfer measurements. HA: Hyaluronic acid; CEST: Chemical exchange saturation transfer.
- Citation: Maloney E, Wang YN, Vohra R, Son H, Whang S, Khokhlova T, Park J, Gravelle K, Totten S, Hwang JH, Lee D. Magnetic resonance imaging biomarkers for pulsed focused ultrasound treatment of pancreatic ductal adenocarcinoma. World J Gastroenterol 2020; 26(9): 904-917
- URL: https://www.wjgnet.com/1007-9327/full/v26/i9/904.htm
- DOI: https://dx.doi.org/10.3748/wjg.v26.i9.904


