Copyright
©The Author(s) 2020.
World J Gastroenterol. Feb 14, 2020; 26(6): 670-685
Published online Feb 14, 2020. doi: 10.3748/wjg.v26.i6.670
Published online Feb 14, 2020. doi: 10.3748/wjg.v26.i6.670
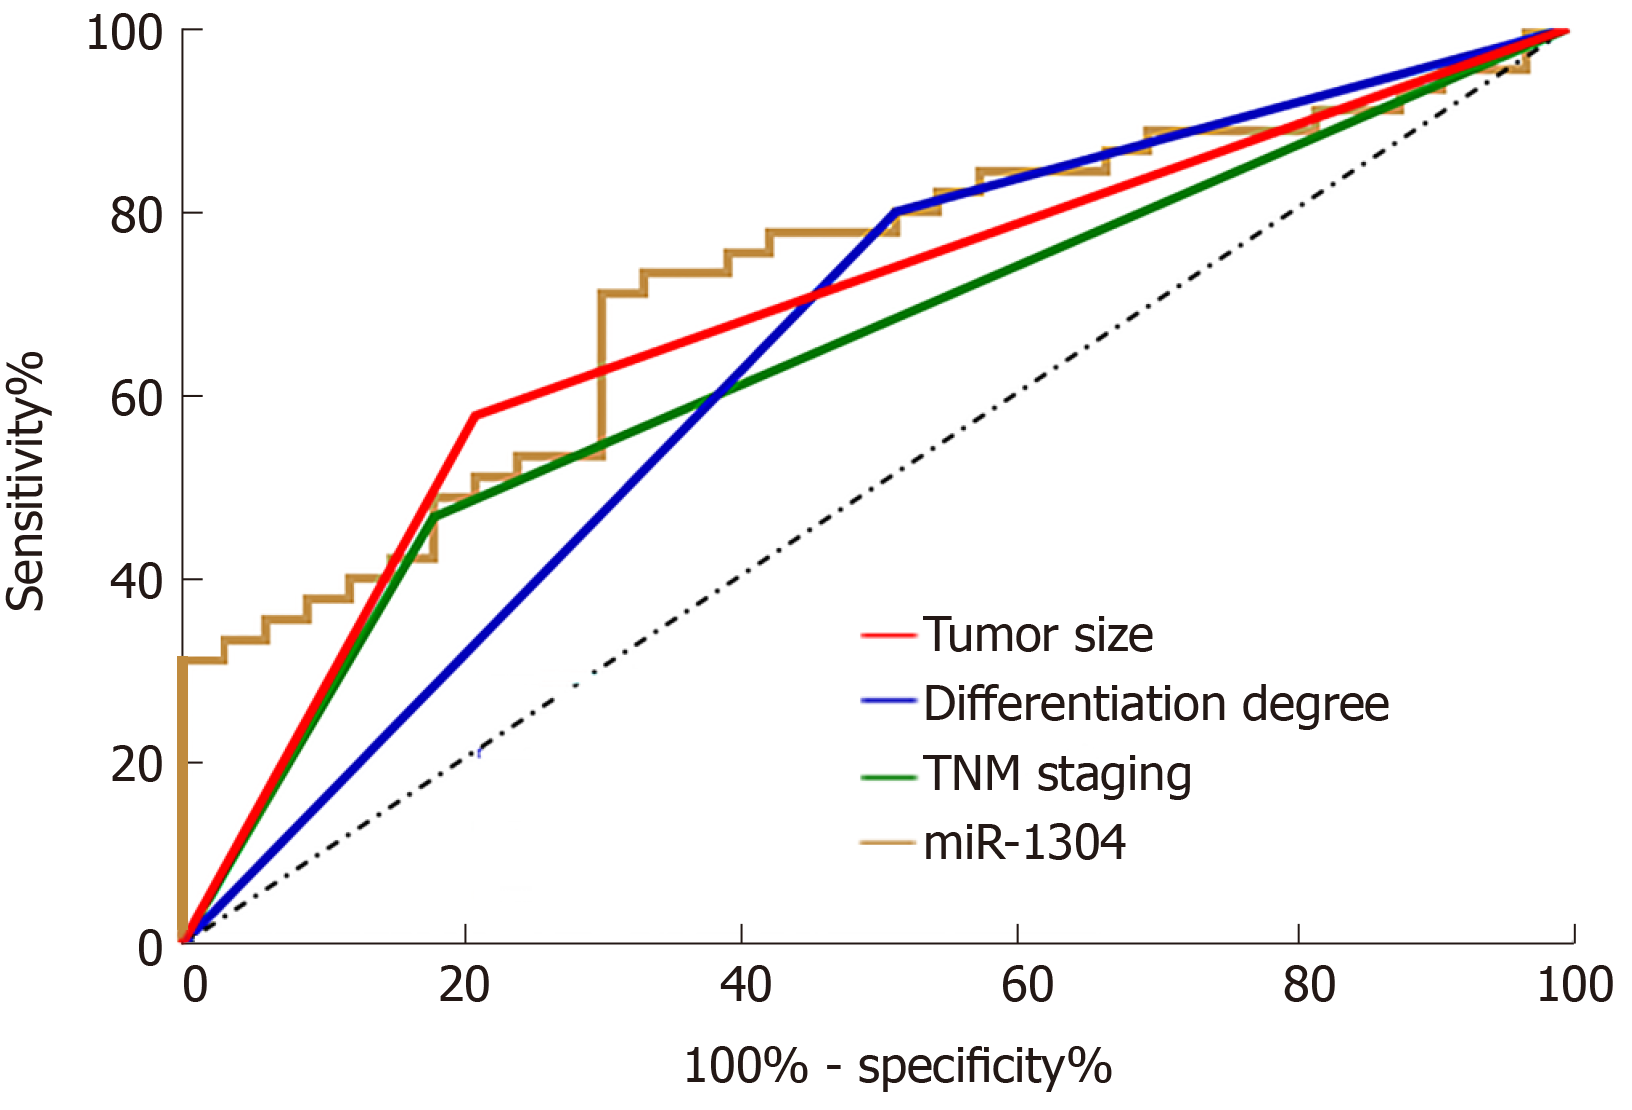
Figure 3 Diagnostic values of independent risk factors for recurrence.
The red line represents tumor size, and its area under the curve (AUC) was 0.683; the blue line represents differentiation, and its AUC was 0.642; the green line represents TNM stage, and its AUC was 0.642, and the light brown line represents miR-1304 and its AUC was 0.721.
- Citation: Luo YG, Duan LW, Ji X, Jia WY, Liu Y, Sun ML, Liu GM. Expression of miR-1304 in patients with esophageal carcinoma and risk factors for recurrence. World J Gastroenterol 2020; 26(6): 670-685
- URL: https://www.wjgnet.com/1007-9327/full/v26/i6/670.htm
- DOI: https://dx.doi.org/10.3748/wjg.v26.i6.670


