Copyright
©The Author(s) 2020.
World J Gastroenterol. Dec 28, 2020; 26(48): 7633-7651
Published online Dec 28, 2020. doi: 10.3748/wjg.v26.i48.7633
Published online Dec 28, 2020. doi: 10.3748/wjg.v26.i48.7633
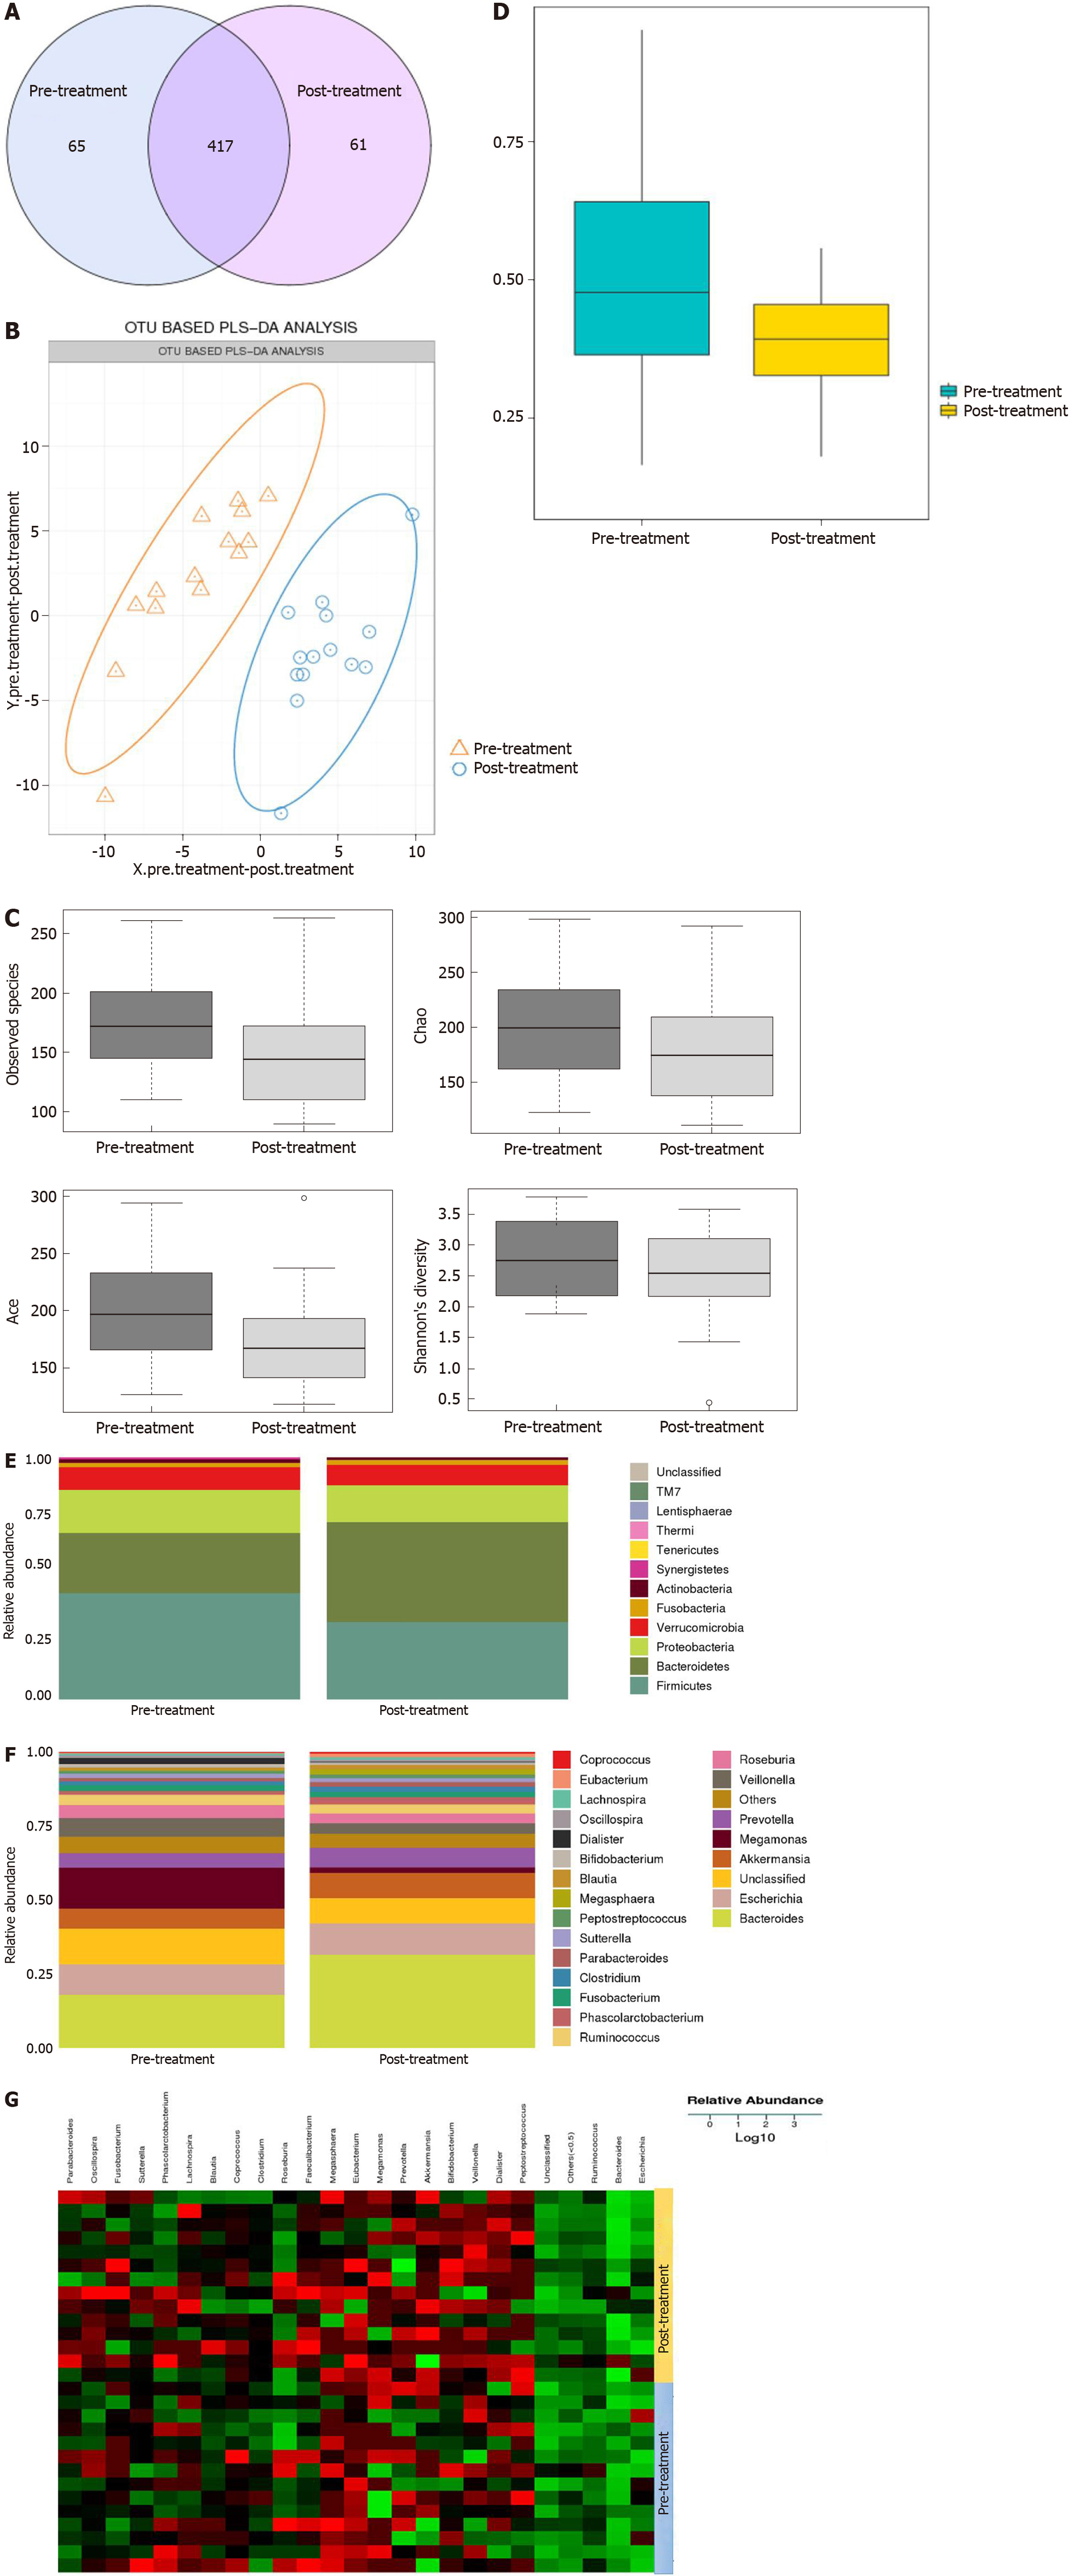
Figure 5 Gegen Qinlian decoction regulated the gut microbiota.
A: Venn diagram of the total number of species shared between the pre-treatment and post-treatment groups; B: Principal coordinate analysis at the operational taxonomic unit level; C and D: Alpha diversity and beta diversity of the gut microbiota in the pre-treatment and post-treatment groups; E and F: Cumulative column chart of relative species abundance at the phylum and genus levels in the gut microbiome between the pre-treatment and post-treatment groups; G: Heatmap showing the changes in gut microbiota at the genus level between the pre-treatment and post-treatment groups. Columns represent samples and rows represent species. OUT: Operational taxonomic unit; PLS-DA: Principal coordinate analysis.
- Citation: Li Y, Li ZX, Xie CY, Fan J, Lv J, Xu XJ, Lv J, Kuai WT, Jia YT. Gegen Qinlian decoction enhances immunity and protects intestinal barrier function in colorectal cancer patients via gut microbiota. World J Gastroenterol 2020; 26(48): 7633-7651
- URL: https://www.wjgnet.com/1007-9327/full/v26/i48/7633.htm
- DOI: https://dx.doi.org/10.3748/wjg.v26.i48.7633


