Copyright
©The Author(s) 2020.
World J Gastroenterol. Dec 14, 2020; 26(46): 7382-7404
Published online Dec 14, 2020. doi: 10.3748/wjg.v26.i46.7382
Published online Dec 14, 2020. doi: 10.3748/wjg.v26.i46.7382
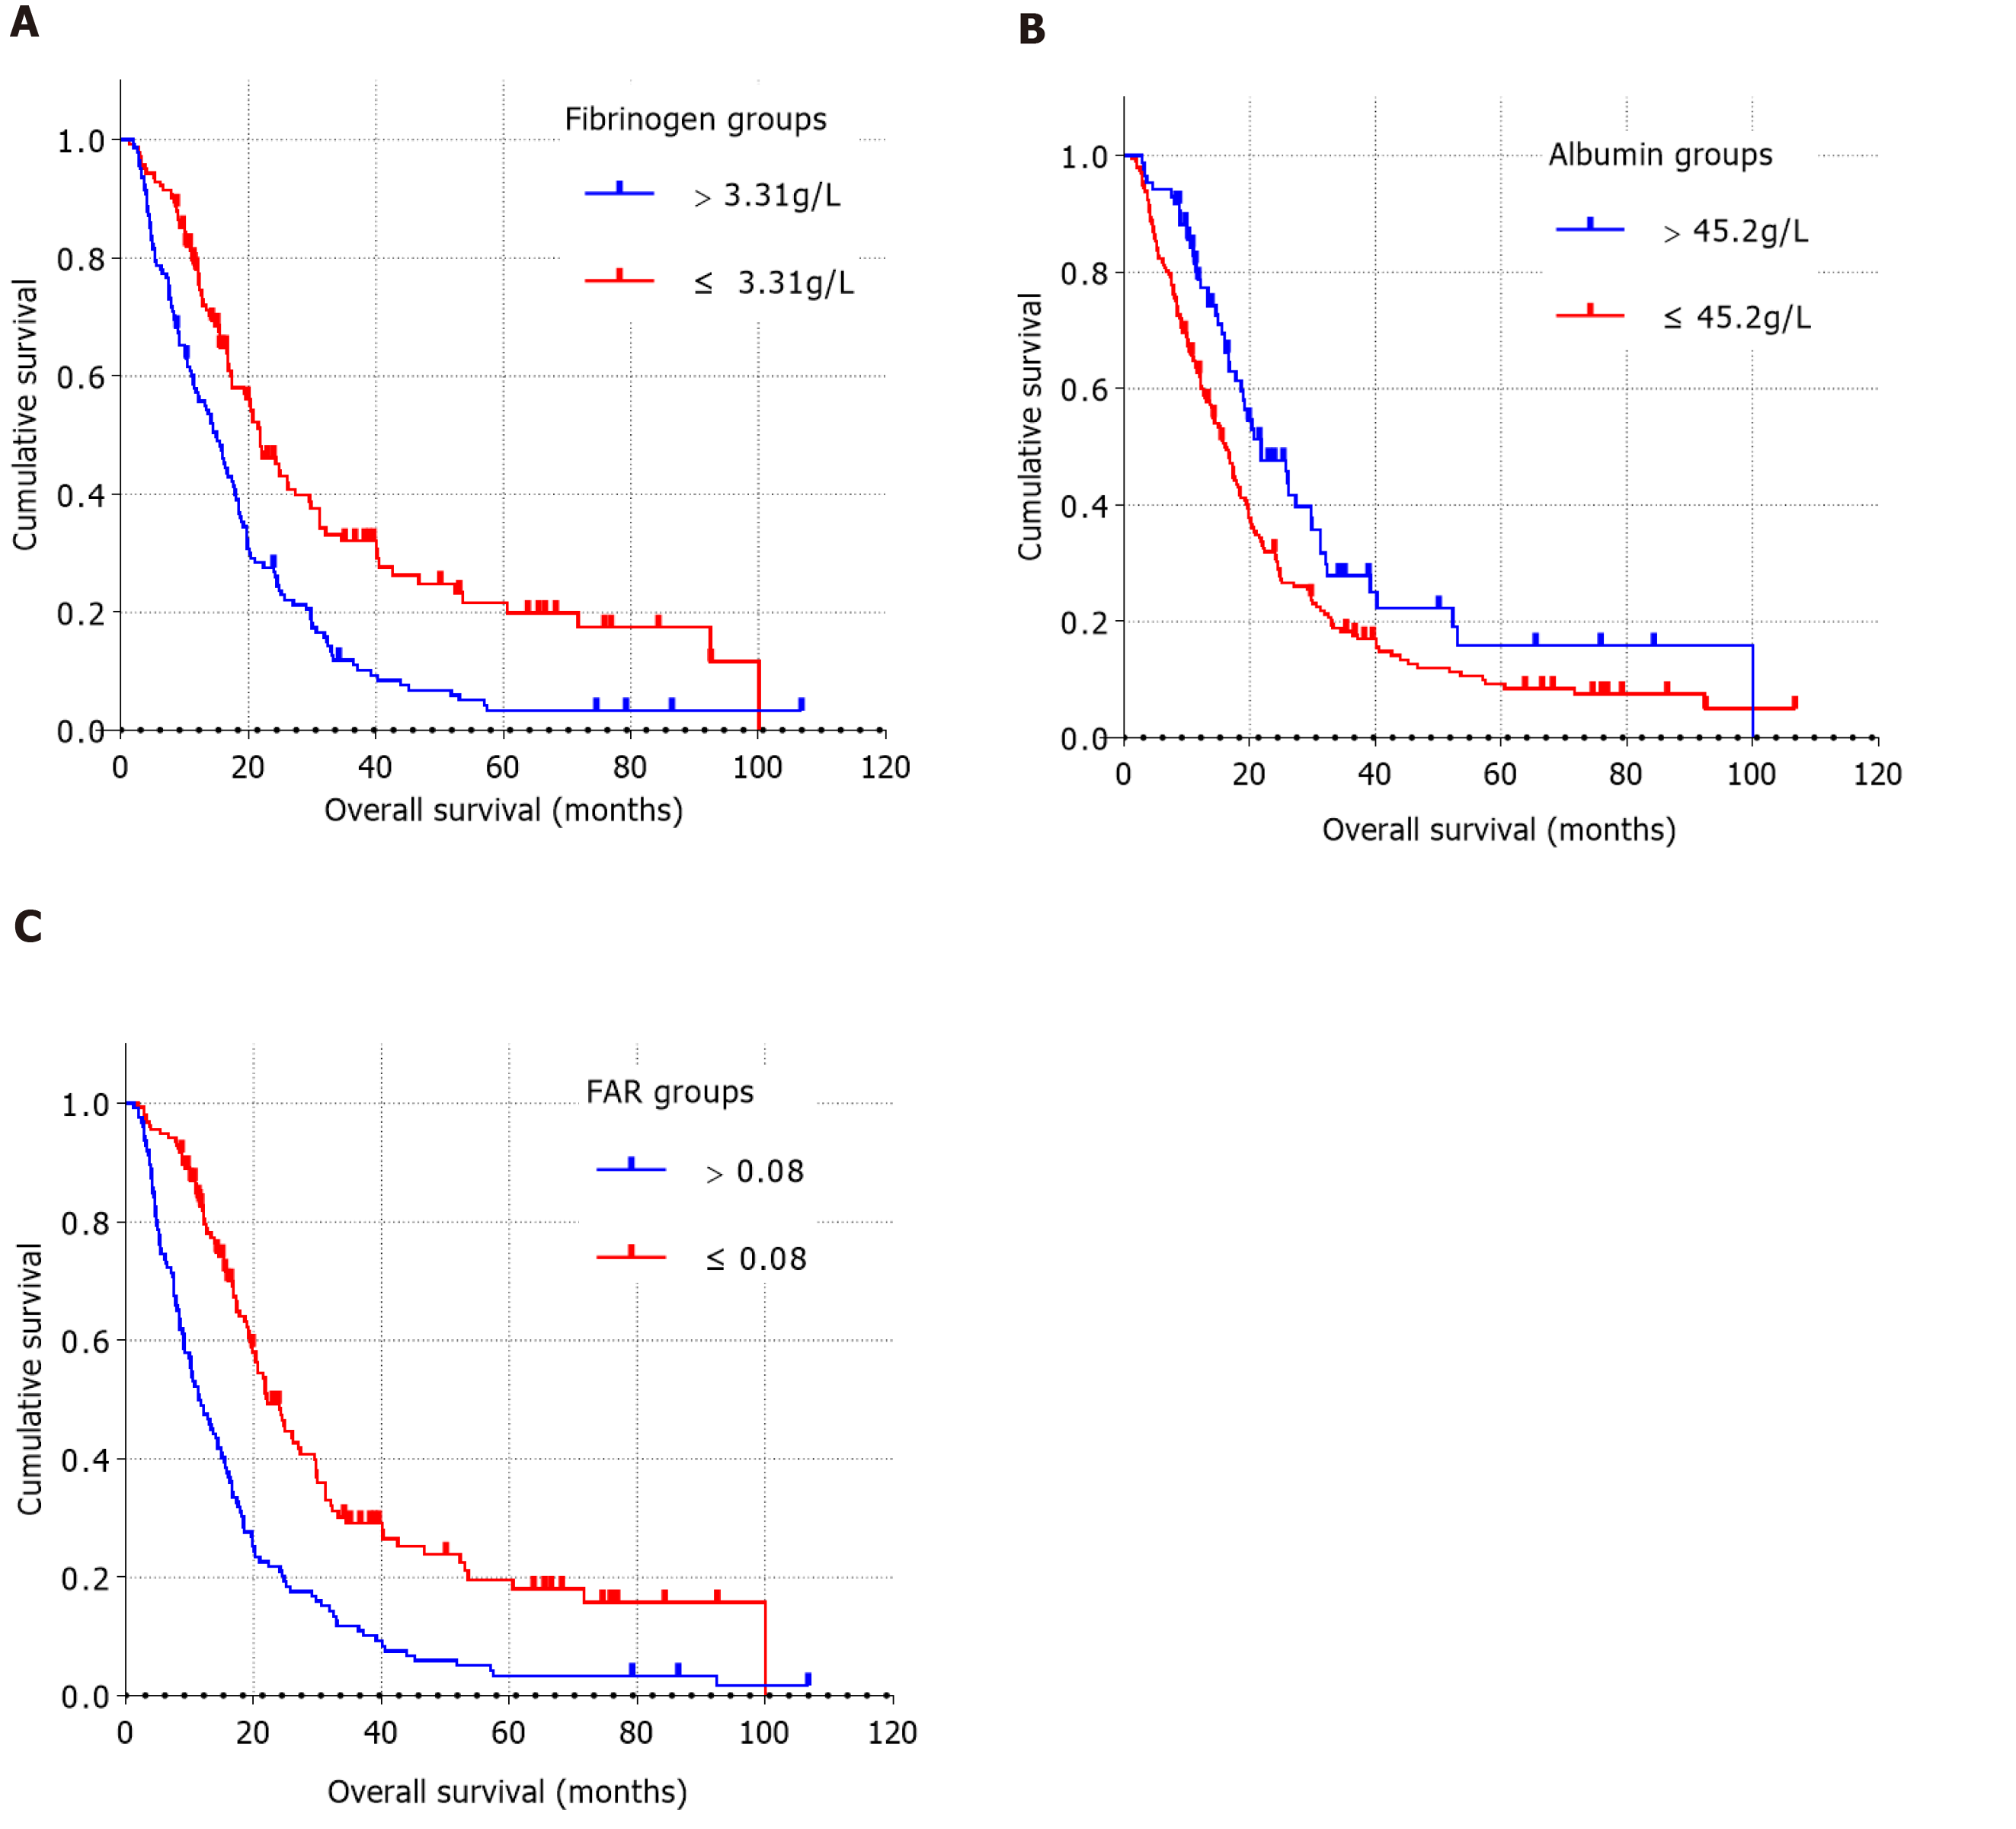
Figure 2 Kaplan-Meier curves were generated by grouping preoperative fibrinogen concentration, albumin level, and fibrinogen-to-albumin ratio using the optimal cut-off values.
A: In the comparison of preoperative fibrinogen concentration > 3.31 g/L with preoperative fibrinogen concentration ≤ 3.31 g/L (P < 0.05), the blue line represents the > 3.31 g/L group and the red line represents the ≤ 3.31 g/L group; B: In the comparison of preoperative albumin level > 45.2 g/L and preoperative albumin level ≤ 45.2 g/L (P < 0.05), the bule line represents the > 45.2 g/L group and the red line represents the ≤ 45.2 g/L group; C: In the comparison of preoperative fibrinogen-to-albumin ratio (FAR) > 0.08 with preoperative FAR ≤ 0.08 (P < 0.05), the bule line represents the FAR > 0.08 group and the red line represents the FAR ≤ 0.08 group.
- Citation: Zhang LP, Ren H, Du YX, Wang CF. Prognostic value of the preoperative fibrinogen-to-albumin ratio in pancreatic ductal adenocarcinoma patients undergoing R0 resection. World J Gastroenterol 2020; 26(46): 7382-7404
- URL: https://www.wjgnet.com/1007-9327/full/v26/i46/7382.htm
- DOI: https://dx.doi.org/10.3748/wjg.v26.i46.7382


