Copyright
©The Author(s) 2020.
World J Gastroenterol. Dec 14, 2020; 26(46): 7382-7404
Published online Dec 14, 2020. doi: 10.3748/wjg.v26.i46.7382
Published online Dec 14, 2020. doi: 10.3748/wjg.v26.i46.7382
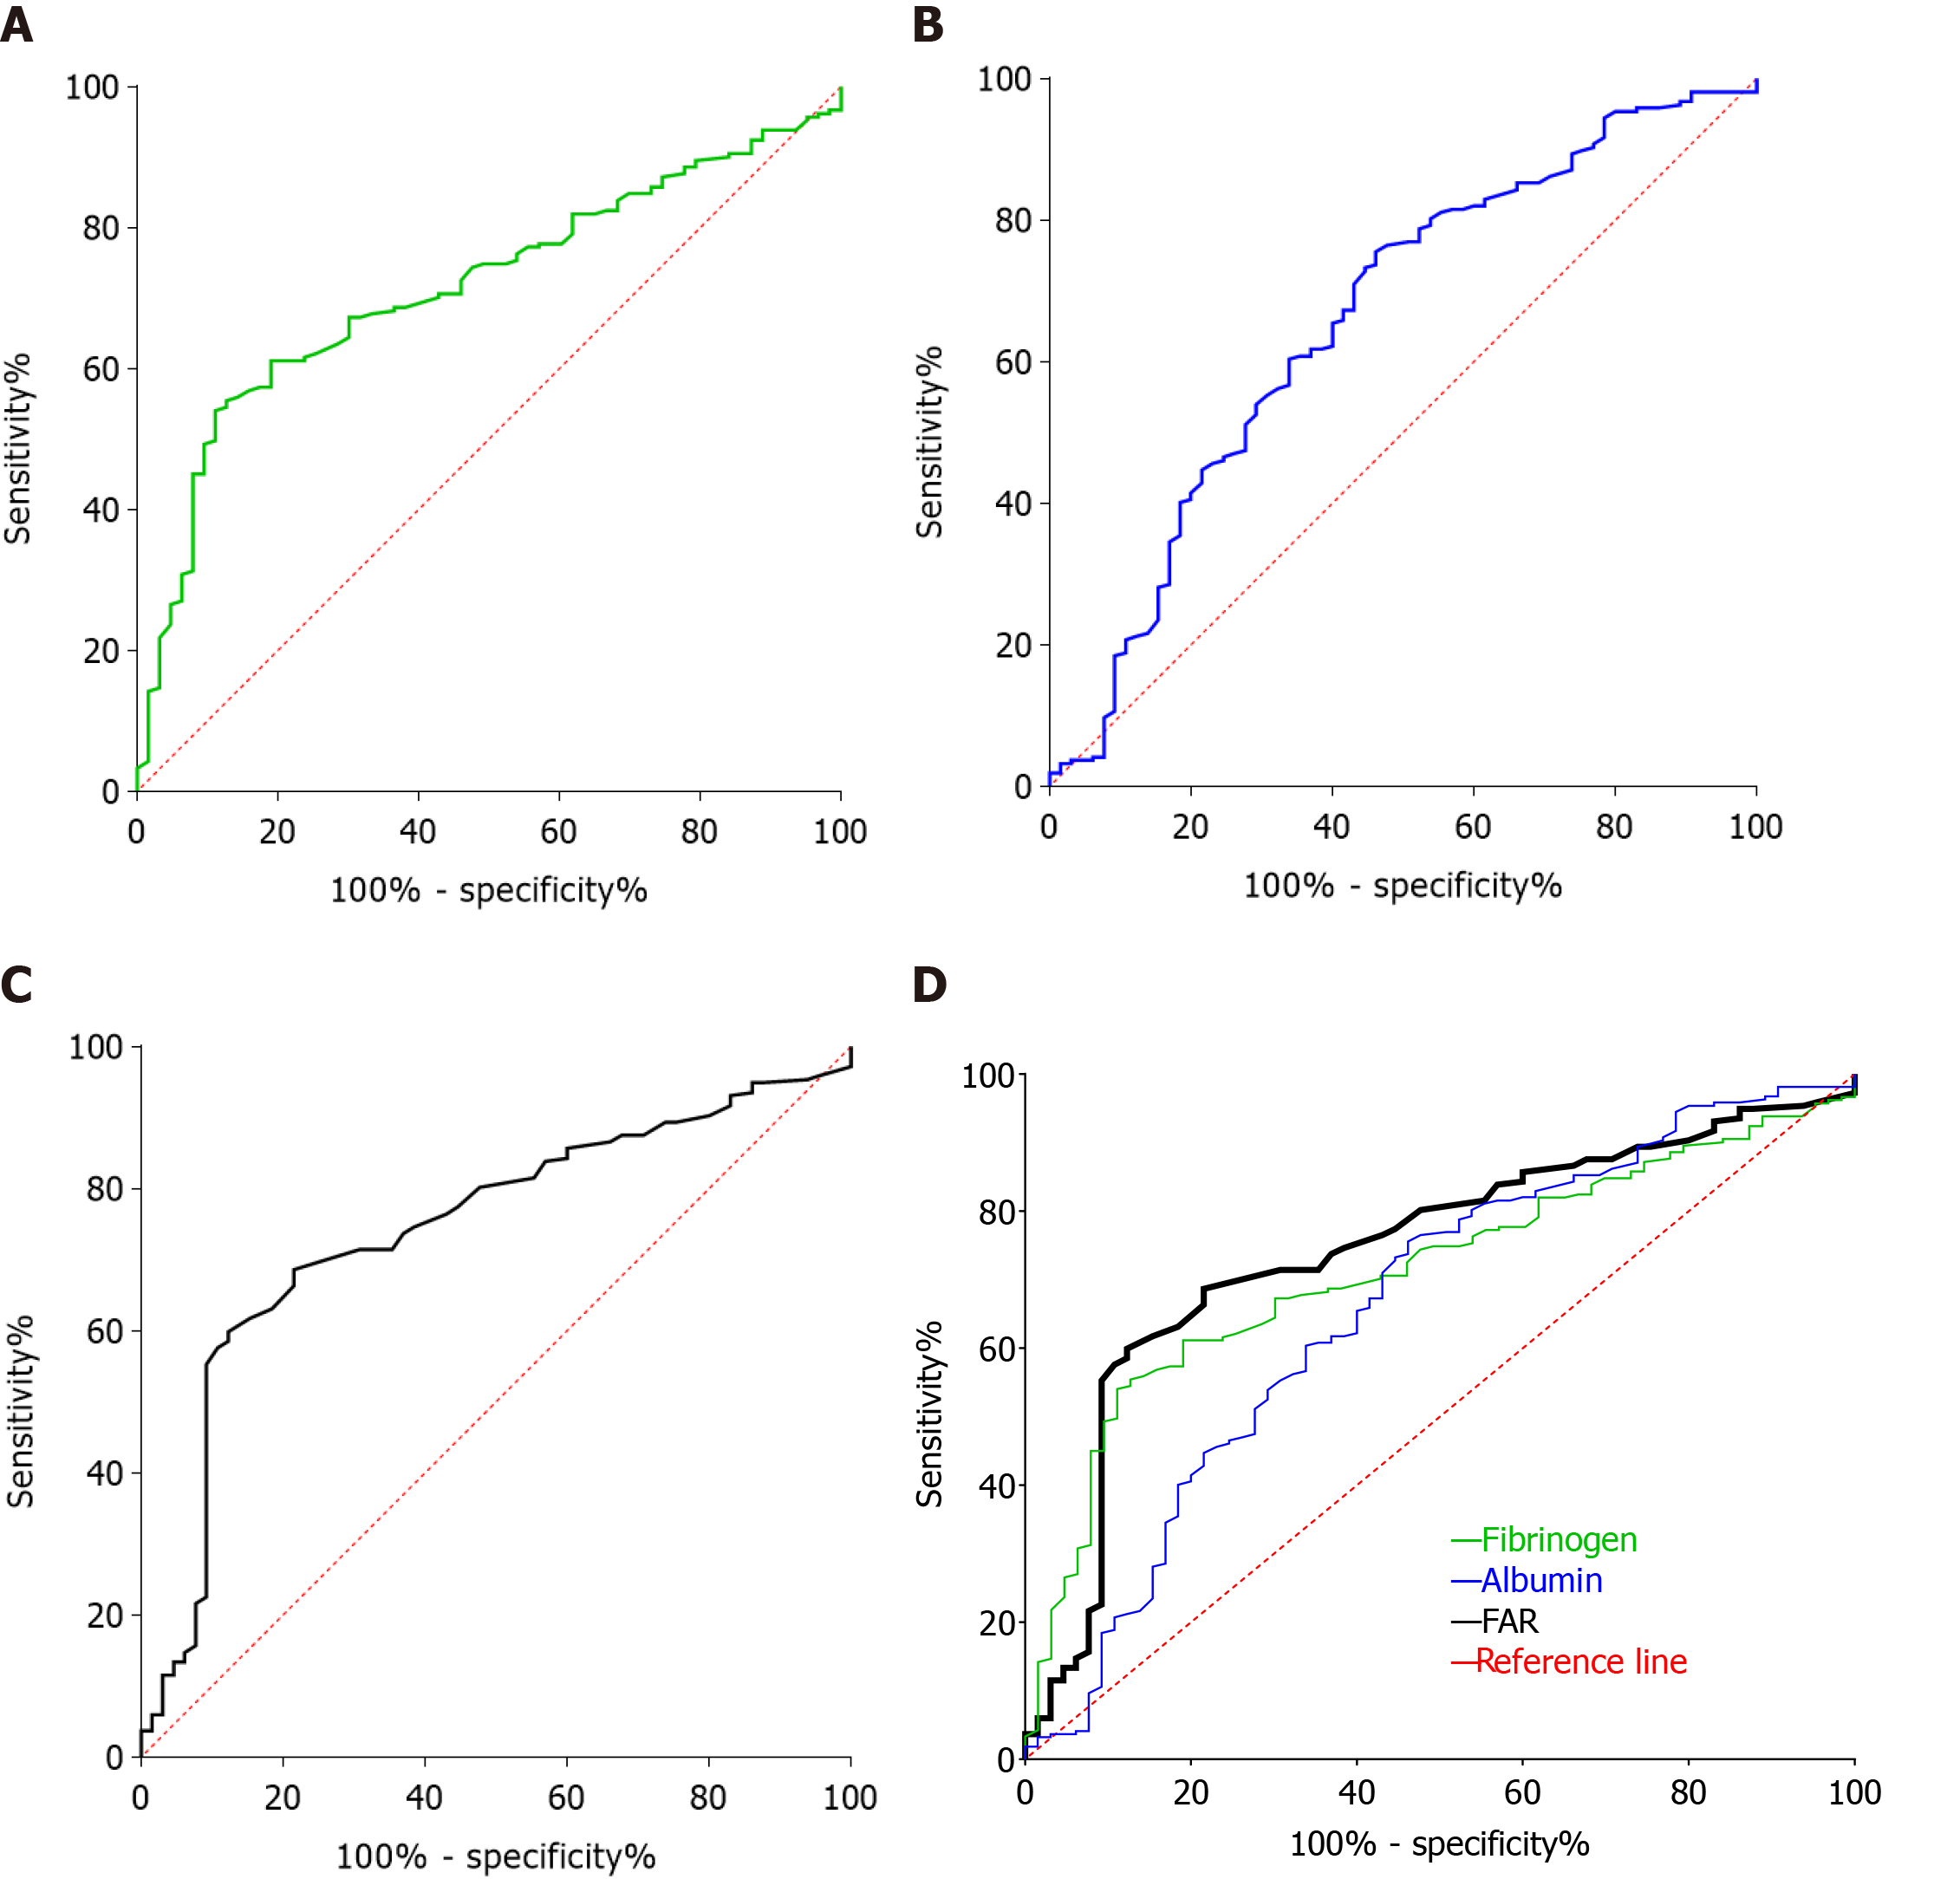
Figure 1 Receiver operating characteristics curve analysis based on preoperative fibrinogen concentration, albumin level, and fibrinogen-to-albumin ratio for overall survival.
A: The area under the receiver operating characteristics curve (AUC) indicates the diagnostic power of preoperative plasma fibrinogen concentration. In this model, the optimum cut-off point for fibrinogen concentration was 3.31 g/L, AUC was 0.714 (95% confidence interval (CI): 0.649-0.779), with a sensitivity of 61.14% and a specificity of 79.37% by the Youden’s index; B: The AUC indicates the diagnostic power of preoperative plasma albumin level. In this model, the optimum cut-off point for albumin level was 45.2 g/L, AUC was 0.659 (95%CI: 0.580-0.738), with a sensitivity of 75.58% and a specificity of 53.85% by the Youden’s index; C: The AUC indicates the diagnostic power of preoperative fibrinogen-to-albumin ratio (FAR). In this model, the optimum cut-off point for FAR was 0.08, AUC was 0.743 (95%CI: 0.677-0.810), with a sensitivity of 59.91% and a specificity of 87.69% by the Youden’s index; D: By comparing AUC, the diagnostic power of FAR was the most powerful.
- Citation: Zhang LP, Ren H, Du YX, Wang CF. Prognostic value of the preoperative fibrinogen-to-albumin ratio in pancreatic ductal adenocarcinoma patients undergoing R0 resection. World J Gastroenterol 2020; 26(46): 7382-7404
- URL: https://www.wjgnet.com/1007-9327/full/v26/i46/7382.htm
- DOI: https://dx.doi.org/10.3748/wjg.v26.i46.7382


