Copyright
©The Author(s) 2020.
World J Gastroenterol. Dec 7, 2020; 26(45): 7131-7152
Published online Dec 7, 2020. doi: 10.3748/wjg.v26.i45.7131
Published online Dec 7, 2020. doi: 10.3748/wjg.v26.i45.7131
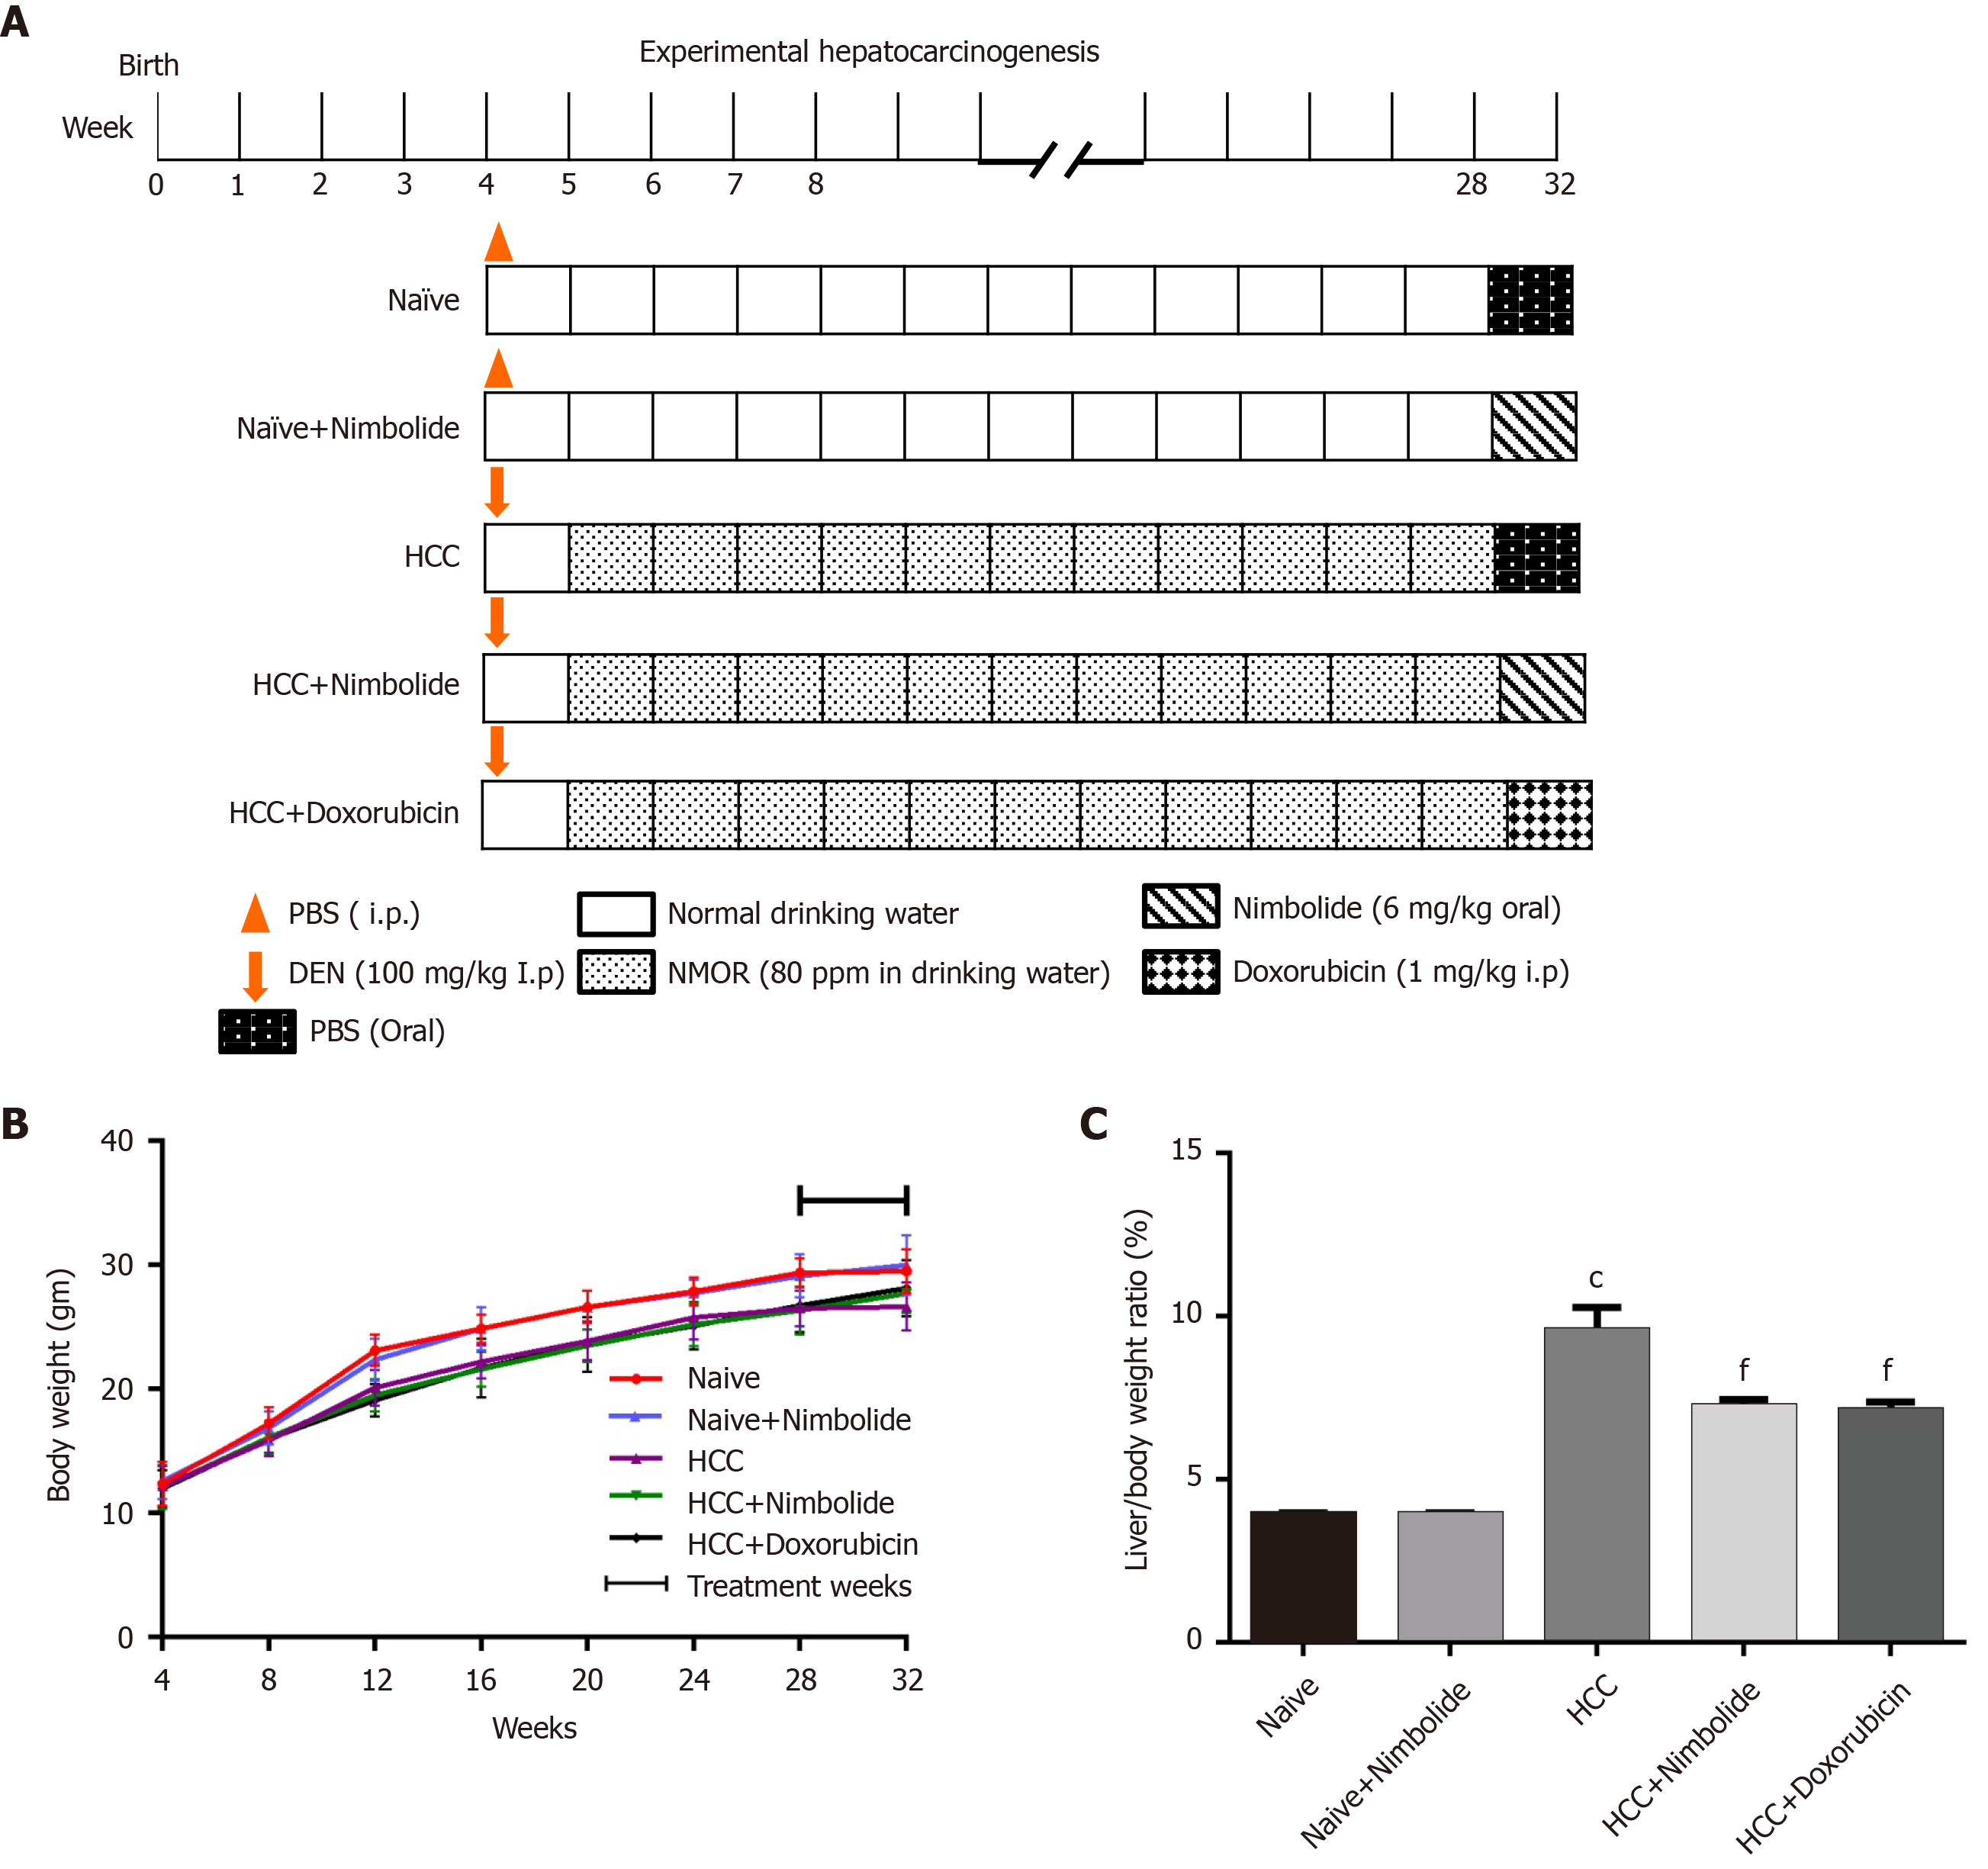
Figure 1 Effect of nimbolide on body weight and liver coefficient in diethylnitrosamine and N-nitrosomorpholine induced hepatocellular carcinoma mice.
A: Flowchart for the experimental hepatocarcinogenesis model; B: Average weekly body weight of naïve and experimental mice; C: Liver coefficient of naïve and experimental mice. All the data are expressed as mean ± SEM (n = 6-10). The comparison between the groups was analyzed by one-way ANOVA followed by Tukey’s multiple comparison test post-hoc test or Kruskal-Wallis followed by Dunn’s multiple comparison post-hoc test. cP < 0.0001 compared to naïve group; fP < 0.001 compared to hepatocellular carcinoma group. DEN: Diethylnitrosamine; HCC: Hepatocellular carcinoma; NMOR: N-nitrosomorpholine; PBS: Phosphate buffer saline.
- Citation: Ram AK, Vairappan B, Srinivas BH. Nimbolide inhibits tumor growth by restoring hepatic tight junction protein expression and reduced inflammation in an experimental hepatocarcinogenesis. World J Gastroenterol 2020; 26(45): 7131-7152
- URL: https://www.wjgnet.com/1007-9327/full/v26/i45/7131.htm
- DOI: https://dx.doi.org/10.3748/wjg.v26.i45.7131


