Copyright
©The Author(s) 2020.
World J Gastroenterol. Nov 28, 2020; 26(44): 7005-7021
Published online Nov 28, 2020. doi: 10.3748/wjg.v26.i44.7005
Published online Nov 28, 2020. doi: 10.3748/wjg.v26.i44.7005
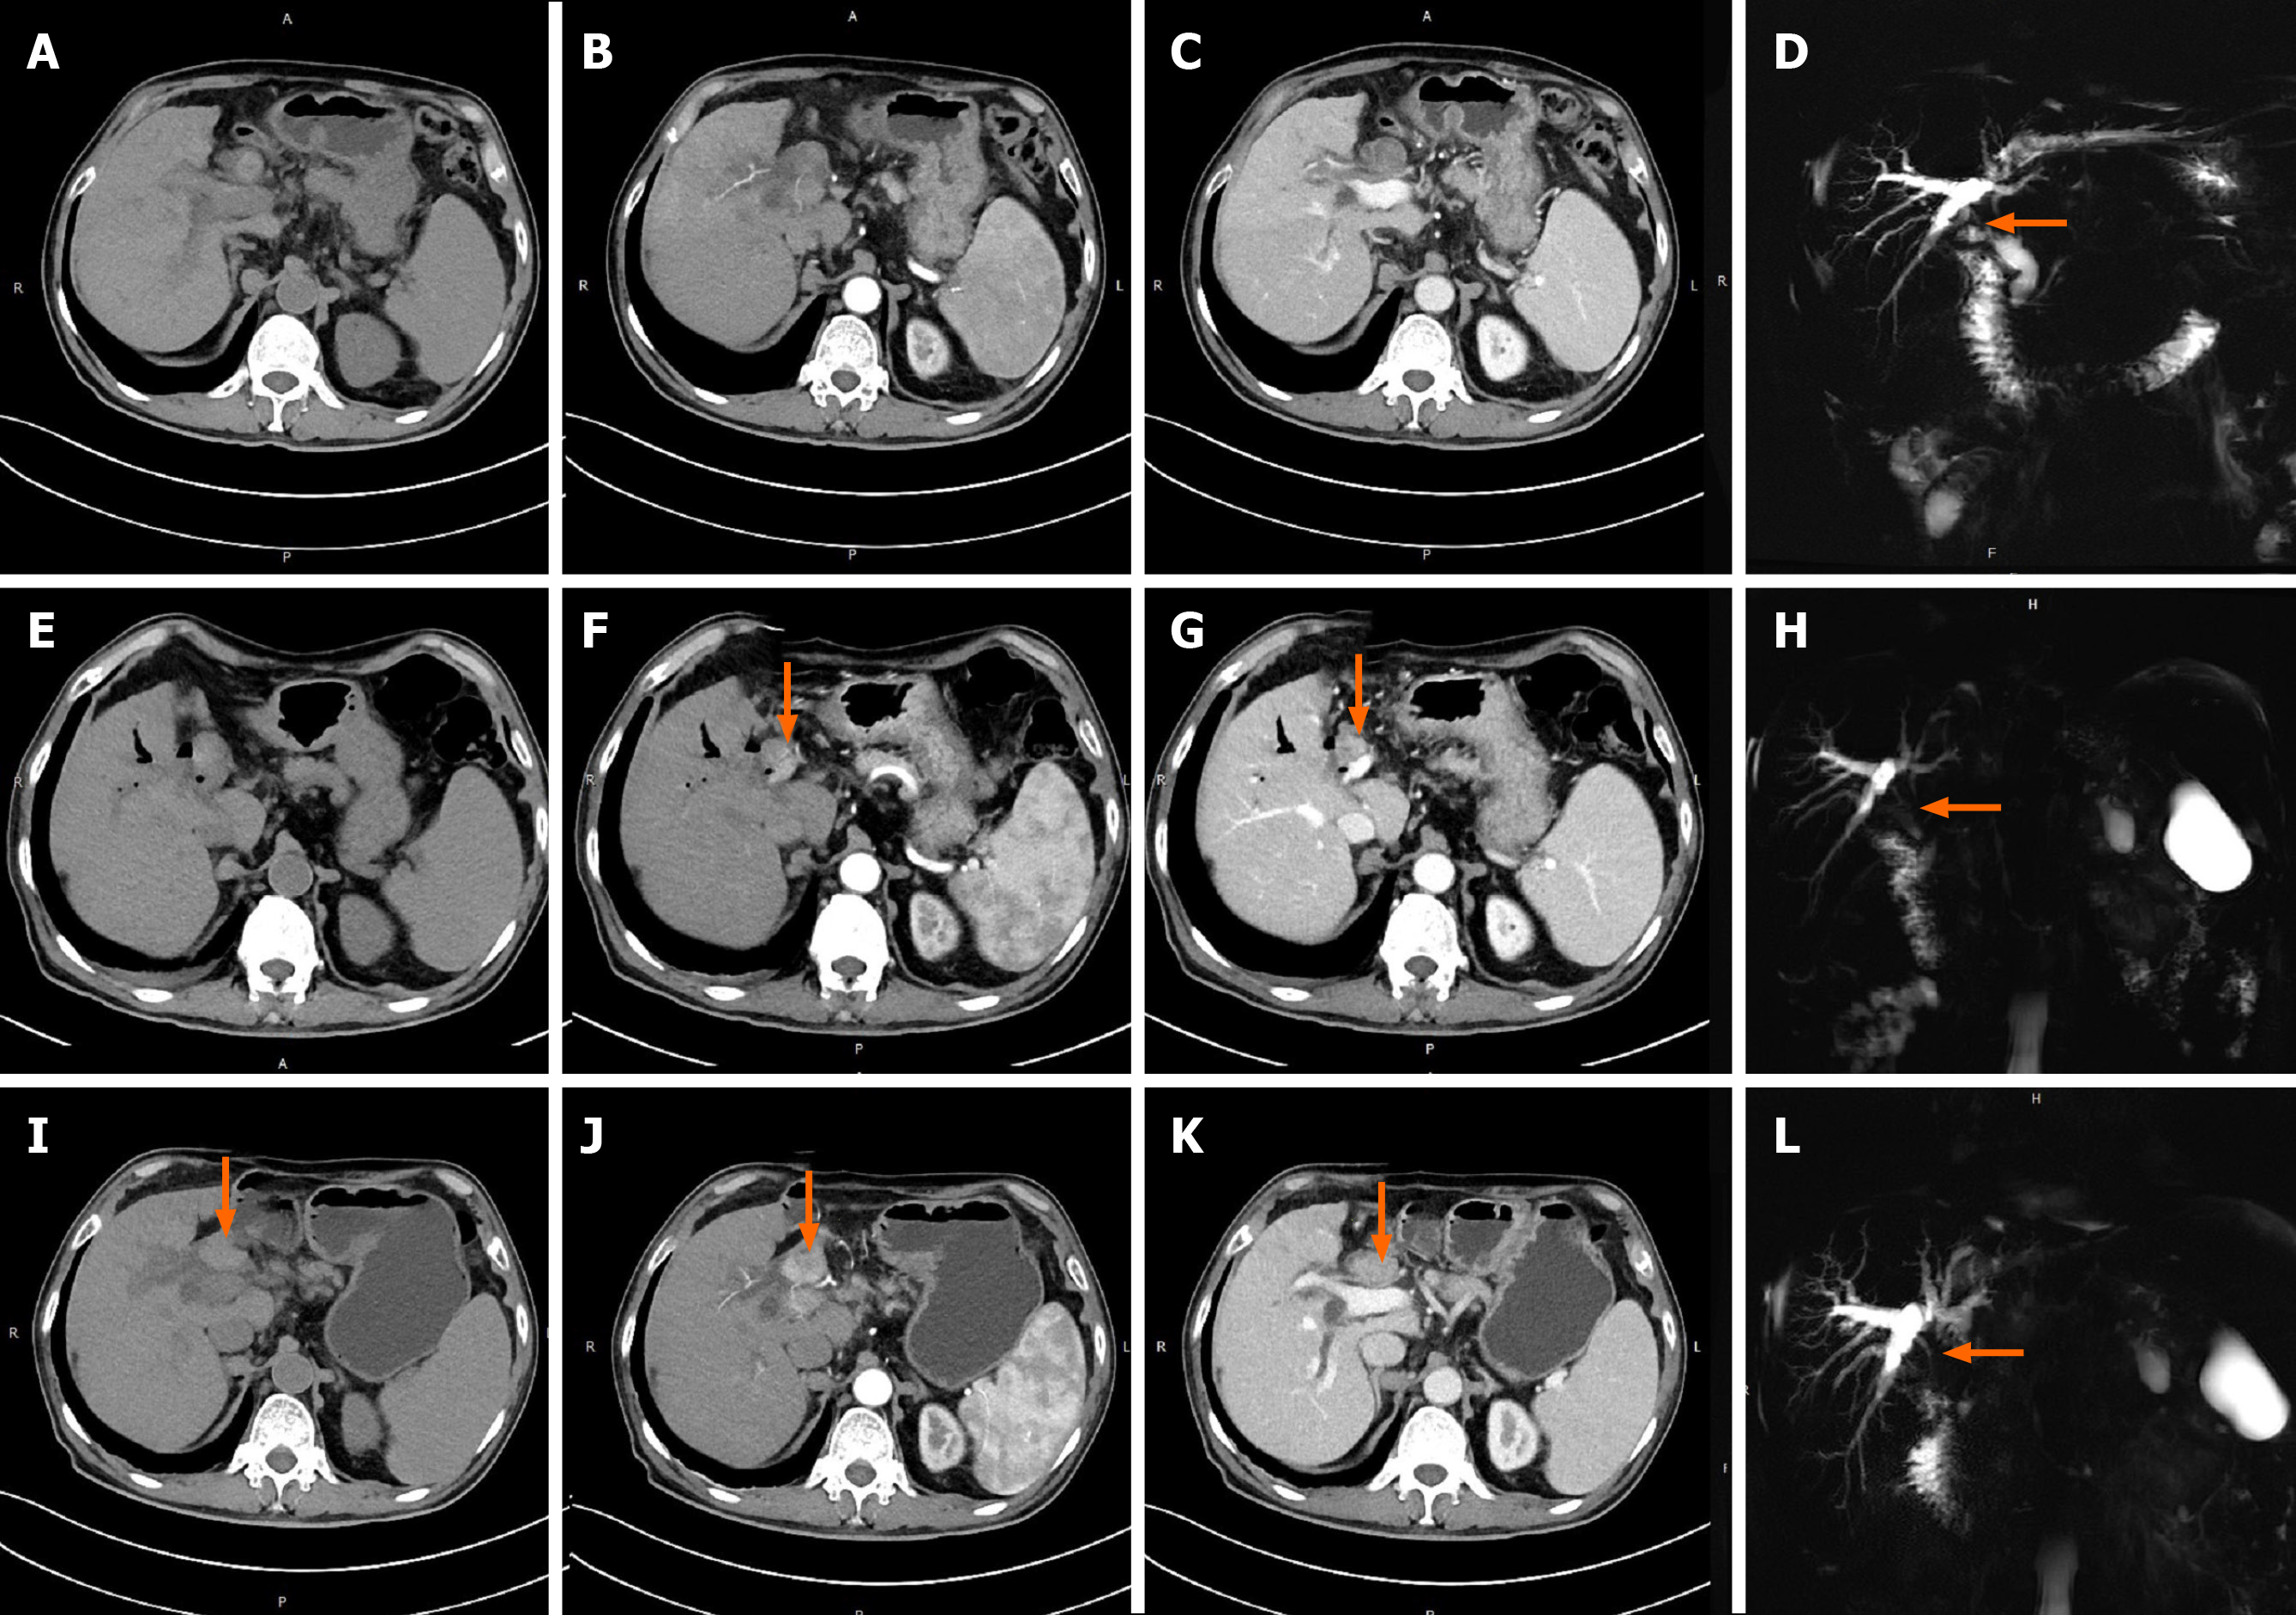
Figure 5 Computed tomography images of patient No.
4. A-F: The yellow arrows indicate hepatocellular carcinoma lesion in hepatic arterial phase (A-C) and portal-vessel phase (D-F). The green arrows indicate bile duct tumor thrombus in the common bile duct.
- Citation: Zhou D, Hu GF, Gao WC, Zhang XY, Guan WB, Wang JD, Ma F. Hepatocellular carcinoma with tumor thrombus in bile duct: A proposal of new classification according to resectability of primary lesion. World J Gastroenterol 2020; 26(44): 7005-7021
- URL: https://www.wjgnet.com/1007-9327/full/v26/i44/7005.htm
- DOI: https://dx.doi.org/10.3748/wjg.v26.i44.7005


