Copyright
©The Author(s) 2020.
World J Gastroenterol. Nov 28, 2020; 26(44): 6945-6962
Published online Nov 28, 2020. doi: 10.3748/wjg.v26.i44.6945
Published online Nov 28, 2020. doi: 10.3748/wjg.v26.i44.6945
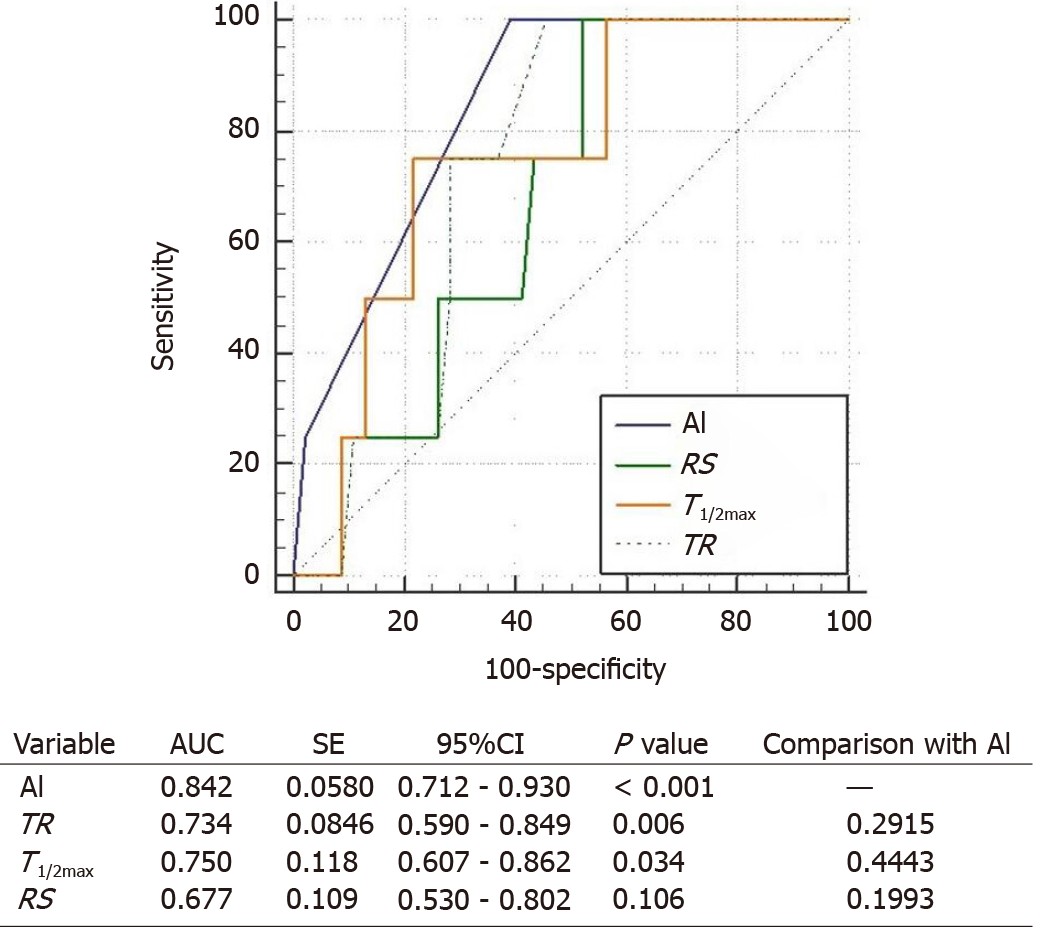
Figure 6 Comparison on the receiver operating characteristic curves of artificial intelligence-based methods and conventional parameters determines the anastomotic complication risk by hypoperfusion.
Artificial intelligence (AI) represents the AI-based method. T1/2max is the time it takes for the indocyanine green fluorescence intensity change to become Fmax/2. Rising slope represents Fmax/Tmax. Time ratio represents T1/2max/Tmax. Area under the curve stands for area under the curve. Statistically significant expresses as P value of less than 0.05. TR: Time ratio; RS: Rising slope; AI: Artificial intelligence; SE: Standard error; CI: Confidence interval; AUC: Area under the curve.
- Citation: Park SH, Park HM, Baek KR, Ahn HM, Lee IY, Son GM. Artificial intelligence based real-time microcirculation analysis system for laparoscopic colorectal surgery. World J Gastroenterol 2020; 26(44): 6945-6962
- URL: https://www.wjgnet.com/1007-9327/full/v26/i44/6945.htm
- DOI: https://dx.doi.org/10.3748/wjg.v26.i44.6945


