Copyright
©The Author(s) 2020.
World J Gastroenterol. Nov 28, 2020; 26(44): 6945-6962
Published online Nov 28, 2020. doi: 10.3748/wjg.v26.i44.6945
Published online Nov 28, 2020. doi: 10.3748/wjg.v26.i44.6945
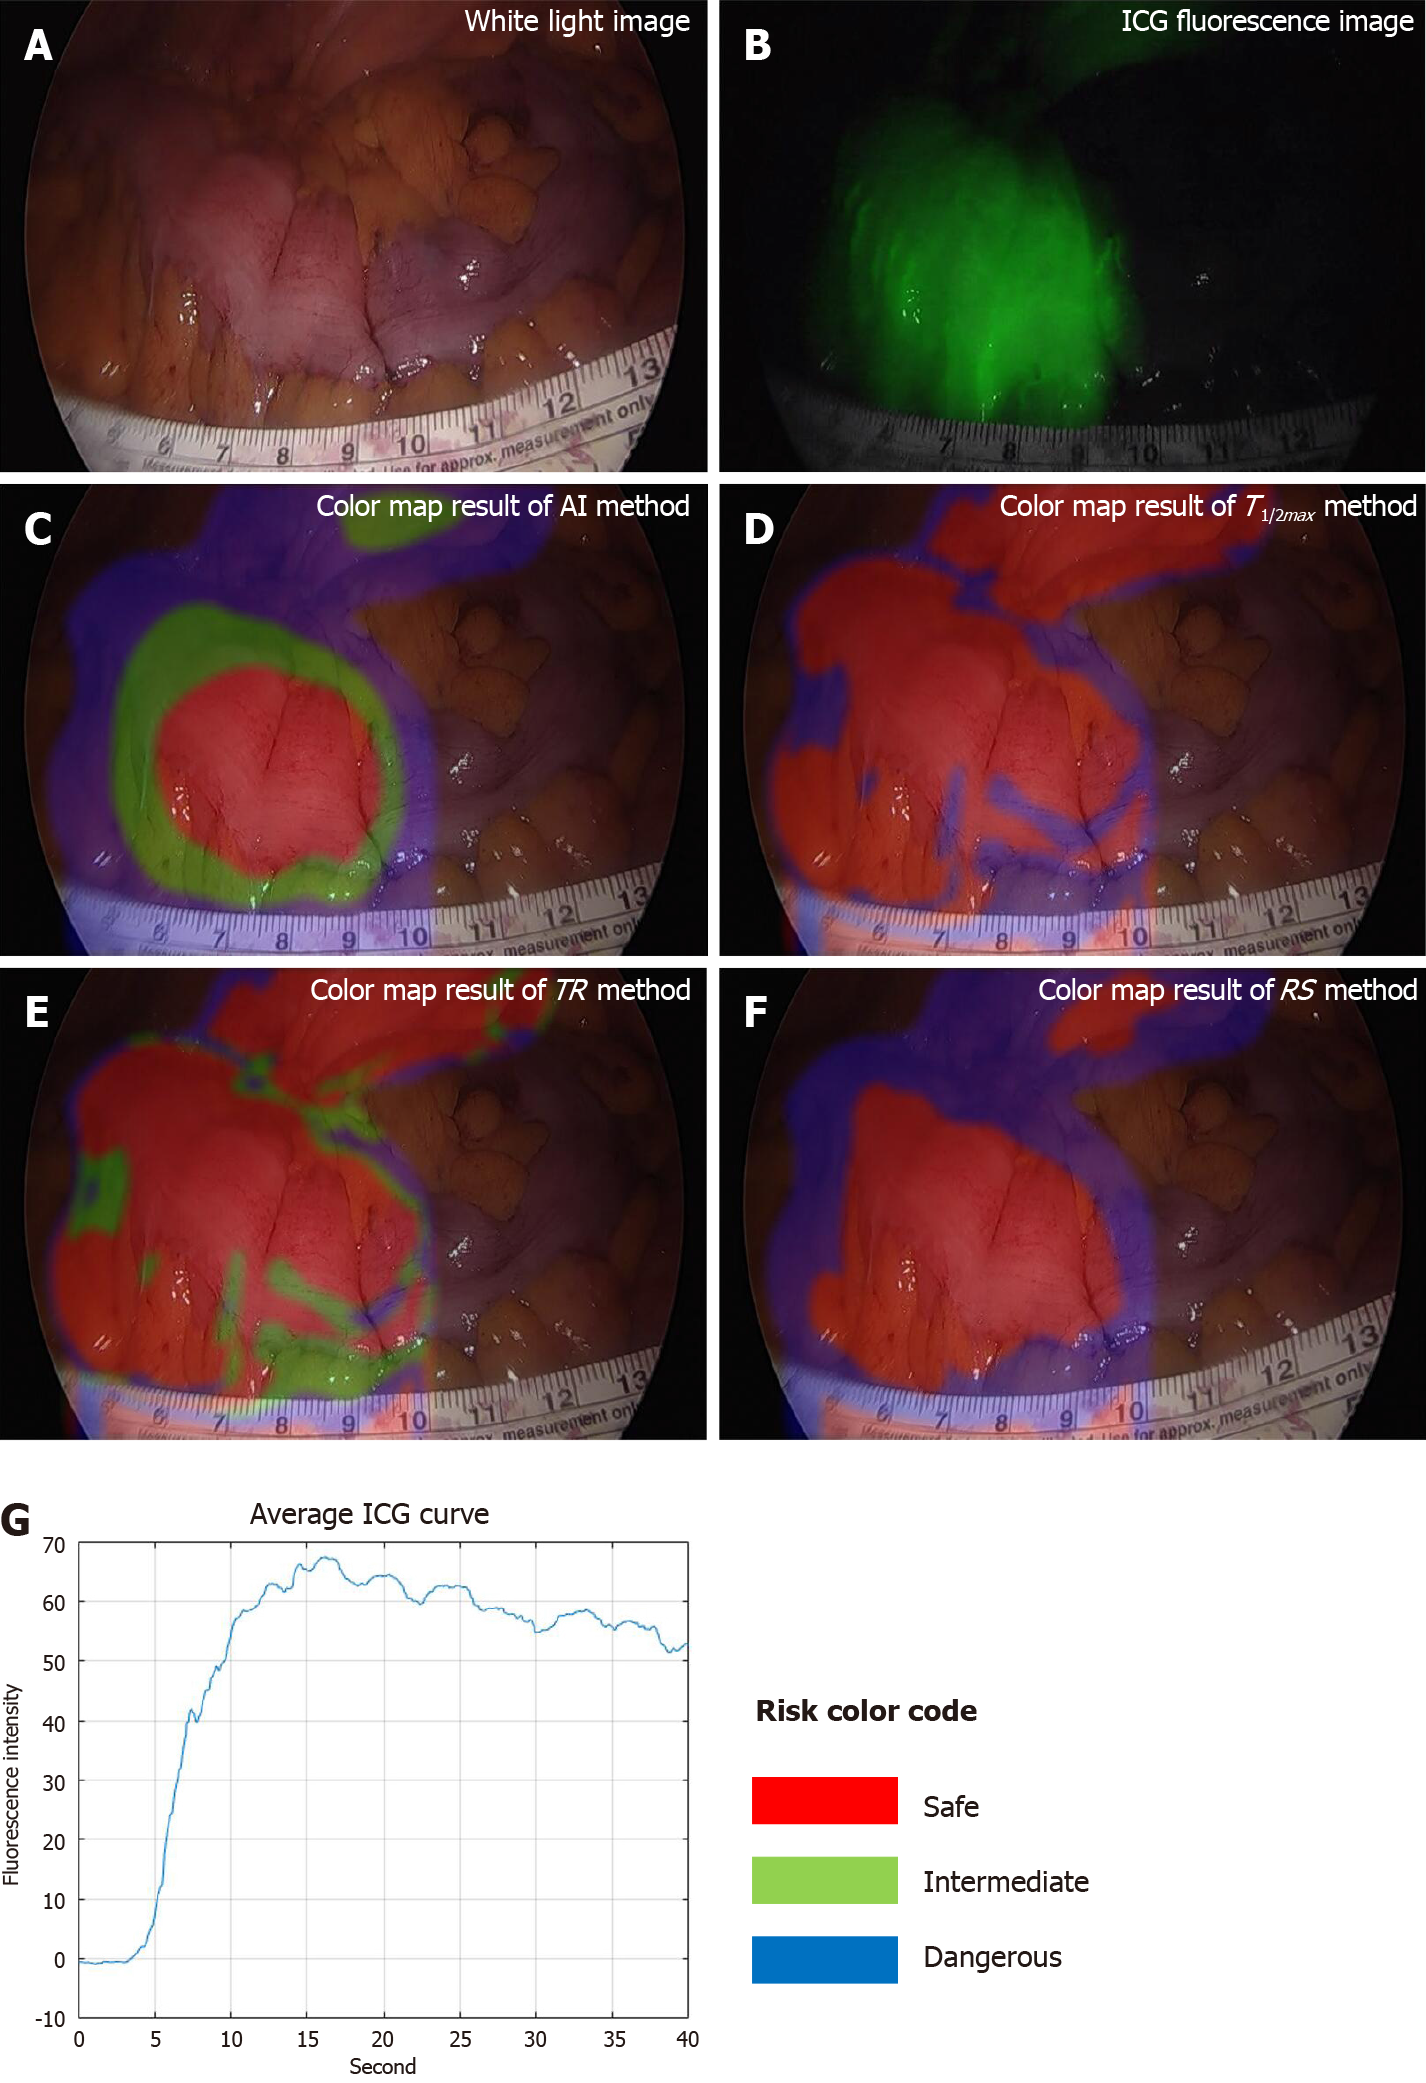
Figure 4 Results of good perfusion patient with small Tmax, large Fmax, and steep indocyanine green curve.
A: White light image; B: Indocyanine green (ICG) fluorescence image, very well observed; C: Color map result of artificial intelligence method; D: Color map result of T1/2max method; E: Color map result of time ratio method; F: Color map result of rising slope method; G: Average ICG curve. The results of all methods were the same as risk-safe. TR: Time ratio; RS: Rising slope; ICG: Indocyanine green; AI: Artificial intelligence.
- Citation: Park SH, Park HM, Baek KR, Ahn HM, Lee IY, Son GM. Artificial intelligence based real-time microcirculation analysis system for laparoscopic colorectal surgery. World J Gastroenterol 2020; 26(44): 6945-6962
- URL: https://www.wjgnet.com/1007-9327/full/v26/i44/6945.htm
- DOI: https://dx.doi.org/10.3748/wjg.v26.i44.6945


